Significance of quantitative operation
Quantitative operation is the basis of refined operation. Through various quantitative indicators, we can clearly see the costs and benefits of enterprise operation, and avoid enterprise operation becoming a confused account. With quantitative indicators, we can evaluate and improve each operation link in a targeted and measurable way, and ultimately obtain higher income and profits. By quantifying operational indicators, we can:
Control operating costs;
Reasonable pricing;
Promote sales;
Customer management;
Shorten settlement cycle;
Optimize products;
Reasonably evaluate business opportunities;
Assessment activities;
Channel management.
In short, the system is the framework and the indicators are the goals. Only with clear and quantifiable indicators can we continuously optimize the operation.
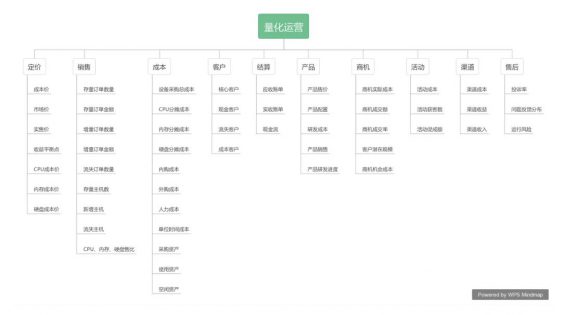
Quantitative operational framework

Pricing quantitative operation indicators
"Pricing is operation" - Inamori's Amiba business philosophy. The pricing requirement is to maximize the product of single profit and sales volume on the basis of correctly judging the value of goods. In addition, this price must be the highest price that customers are willing to pay for. We must strive to maximize profits within the price set after careful consideration.
Pricing is the starting point and core of all operations. The indicators to be considered include cost price, market price, actual selling price, variable cost, fixed cost, break even point, etc.
Price index:
Cost Price: total cost of each product (unit variable cost+unit apportioned fixed cost)
If the product is priced at a single price, the total cost of each product is easy to calculate: the total cost of a single product=total variable cost/producible quantity+total fixed cost/producible quantity.
For example, in the IAAS service, the virtual machine has only one specification, such as 4vCPU 8G memory. We have purchased a batch of host computers for delivery of virtual machines of this specification. Assuming that the annual depreciation cost of the purchased equipment is 90000 yuan (variable cost), 100 4vCPU8G virtual machines can be delivered (production quantity), and the annual fixed costs such as labor costs, office space leasing, etc. are assumed to be 100000 yuan in total.
Then the cost price of each 4vCPU8G virtual machine is:
Cost price=90000/100+100000/100=900+1000=1900 yuan/year ≈ 158.33 yuan/month.
It can be seen that when a single product has a single specification, the cost price of the product is relatively easy to calculate, but generally, the product specifications are diverse. For example, in addition to the 4-core 8G virtual machine, we also have 1vCPU1G, 1vCPU2G, 2vCPU4G, 4vCPU4G, 8vCPU16G and many other products with different specifications. So how to calculate the cost price and how to produce the optimal scale ratio (the optimal sales ratio of virtual machine) is a complex mathematical planning problem. However, this paper proposes another more simple method for calculating the cost price, that is, the cost accounting of pricing elements.
Without considering the CPU hardware model, the cost of virtual machine is generally determined by pricing factors such as vCPU, memory, and hard disk capacity. We only need to calculate the unit vCPU cost, unit memory cost and unit disk cost. Then, cost price=unit vCPU cost * used quantity+unit memory cost * used quantity+unit disk cost * used quantity
In IAAS services, storage nodes are generally independent of computing nodes and network nodes, and their unit costs are relatively easy to calculate. It can be calculated according to the single mode of product planning. Disk unit cost=total variable cost/producible quantity+total fixed cost/producible quantity.
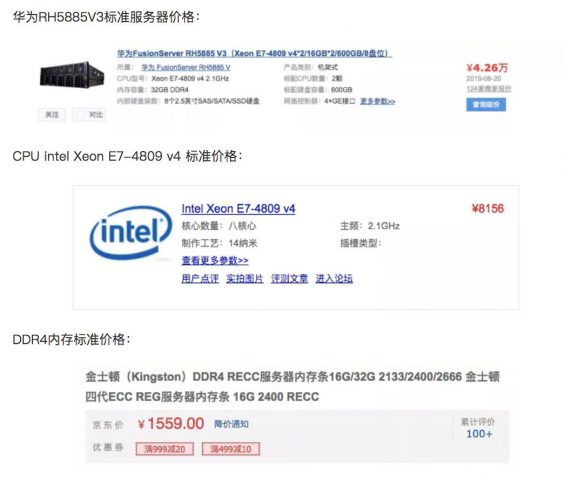
In IAAS cloud computing, in order to enable the cluster to drift, the CPU model of the servers purchased in the same cluster should be the same. For example, we purchased a batch of Huawei service equipment RH5885V3 as the physical node. For the price, see the quotation of Zhongguancun Online:

As can be seen from the figure above, the standard configuration of the server is 8 * 2=16 physical cores and 16 * 2=32GB memory. In the IAAS service, the CPU is generally over configured by 6 times, that is, a total of 16 * 2 * 3=96vCPU. Therefore, we need to supplement the number of memory modules. We can simply expand by vCUP: memory=1:2, so we need to expand 10 more 16GB memory modules, that is, the server has a total of 16 * 12=192GB memory. Our final reasonable purchase configuration should be 16 physical cores and 192GB of memory, so the final cost of our server purchase is 42500+1559 * 10=58090 yuan.
Among 58090 yuan, we know that CPU cost is 8156 * 2=16312 yuan, memory cost=1559 * 12=18708 yuan, and other costs=23070 yuan. Because the vCPU and memory measurement methods are different, it cannot be directly allocated by quantity, but can be allocated by cost ratio. This allocation method is essentially the logic of variable cost method to allocate fixed costs
In addition, in order to ensure the cluster has a certain degree of redundancy, the vCPU and memory both reserve a 30% idle rate, so:
Cost per unit vCPU=(16321/96+111.94)/0.7=402.65 yuan/vCPU
Cost per unit of memory=(18708/192+64.19)/0.7=228.05 yuan/GB
If the depreciation is based on 3 years, the unit time cost of vCPU and memory is:
Monthly cost per unit vCPU=357.12 ÷ 36=11.85 yuan/month
Monthly cost per unit of memory=253.625 ÷ 36=6.33 yuan/month
Above, only the variable costs of vCPU and memory are calculated. We also need to consider the allocation of fixed costs. Assume that the variable costs and total production of various pricing elements of the virtual machine are as follows:

Assume that the fixed costs such as labor cost and office space rental are 1000 yuan/month. The fixed cost of 1000 yuan/month is apportioned according to the variable cost of CPU, memory and hard disk. The cost prices of three core pricing elements of virtual machine are obtained as follows:

Cost price is actually an extreme pricing mode, which can be used to verify whether our business can continue to develop.
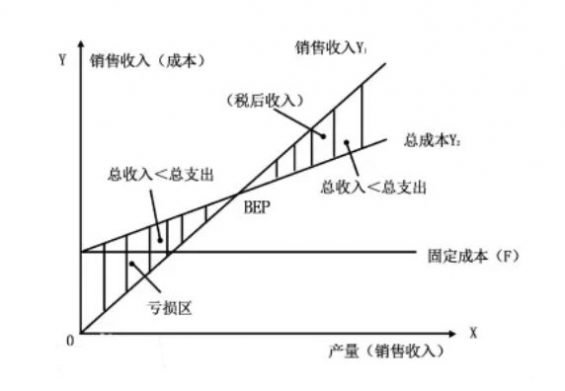
If the market price is lower than the unit variable cost, the larger the sales scale of the enterprise, the greater the loss, and the business is basically unsustainable.
If the market price is higher than the unit variable cost, but lower than the total unit cost, then the increase in the sales scale of the enterprise can only reduce the scale of losses, but cannot achieve profits, and the business is also unsustainable.
If the market price is higher than the total unit cost, there will be a profit balance point problem, which usually refers to the output when all sales revenue is equal to all costs (the intersection of the sales revenue line and the total cost line).

The cost price and break even point are a dynamic process in the business process of an enterprise. As operators, we need to calculate the cost and break even point regularly.
Market Price: the product price in the current market. Operators regularly obtain the market prices of relevant competitors in the market through various channels, and compare the difference between their own prices and market prices.
Actual selling price: the actual selling price of our own products. In terms of pricing strategy, the best strategy is to follow the market price directly, which can be flat or slightly higher or lower.
Pricing is the key to the success or failure of business. When setting the price, should we choose small profits and quick turnover, or would we prefer to sell in a small amount and also ensure a higher profit margin?
There are many options for pricing. After determining a certain profit margin, it is very difficult to predict how much the sales volume will reach and how much profit will be generated. Operations must find the point where the product of sales volume and profit margin reaches the maximum on the basis of correctly estimating the value of their own products.
Sales quantitative operation indicators
In the B-end operation, a common feature is that the customer places an order once, leases for a long time and pays the fees regularly. The platform is sticky to B-end customers, and there is a certain cost for customers to switch platforms. The B-end will not switch easily without major changes in the external environment and organization. Therefore, in the B-end operation, it is necessary to always pay attention to the stock orders.
Quantitative indicators mainly include: quantity of stock orders, amount of stock orders, quantity of new orders, amount of new orders, quantity of terminated orders, amount of terminated orders, sales ratio of product specifications, and cash flow (sales collection).
It can be analyzed and monitored by time dimension (year, quarter, month, week, day), customer dimension, product dimension, cloud environment dimension, etc.
The quantity and amount of sales orders directly affect the operating revenue of the platform, so it is necessary to monitor the changes of orders in real time. For example, if we observe the change of orders according to the time dimension, we can find that there is generally a slack and peak sales season for products, usually the sales from October to February at the beginning of the year, which is much higher than the sales from May to August in the middle of the year. The corresponding resource allocation and product promotion should be adjusted accordingly.
Pay attention to the change trend of stock orders, understand the reasons for the change, and take different measures according to different reasons, such as whether the increase in stock is due to the purchase of new customers or the purchase of old customers.
For the purchase of new customers, it is necessary to ensure the customer's first purchase service experience. The customer's first product experience largely determines whether to establish a long-term cooperative relationship with the platform. For regular customers to buy, we should consider the depth needs of customers, help customers optimize costs, optimize services, and establish long-term trust and cooperation.
For Laoge, for example, if the order loss is caused by business changes or attracted by other market competitors, different measures should be taken according to different situations. Changes in stock orders will have a great impact on the platform's long-term revenue. It is necessary to take response measures to avoid the loss of stock orders, and constantly expand new customers and new orders.
Cost quantitative operation indicators
In the process of cost quantification, the first goal is to clarify the cost composition of platform operation. We conduct cost accounting according to the following table, mainly to clarify how much we spend, where we spend it, and how we apportion it.

Only by clarifying the cost structure in the platform operation can we better control costs. Especially in the current economic downturn, cost control is the easiest choice for enterprises. After all, open source requires external input, and cost control can be solved internally. The layoff of Internet companies is a living example. If you take a look at the cost composition of Internet companies, you will find that labor costs are the major part of Internet enterprises. From the perspective of cost control, layoff becomes a necessary means.
Customer quantitative operation indicators
In customer management, the B-end operation platform has a very obvious principle of "two eight", that is, 20% of customers contribute 80% of the revenue. The scale of these customers' use affects the overall platform revenue. It is necessary to invest in full-time sales for customer tracking and service management. It is also necessary to provide necessary support for operational security. It is necessary to regularly analyze the use of core customers, find out in advance the abnormal situation of customers, whether the business is developing rapidly, whether the business is shrinking, whether the customer is prone to loss, and so on. For the other 80% of customers, attention should be paid to customer growth, loss and customer conversion rate.
Quantitative operation indicators of settlement
In settlement management, an important indicator is sales collection. Whether sales can be collected in time will always affect the normal operation of the platform, even the life and death of the entire platform. As a platform operator, when building the operation system, we should plan the sales collection cycle and collection means of the platform to avoid too long collection cycle It even causes bad debts.
In the operation of big B customers, the core big B The customer has strong negotiation ability, which makes the account period of sales collection very long. At this time, the best way is that the platform we operate must be strongly related to the user's core business, so that everyone can be prosperous and lose, so that the platform can have a large negotiation margin, and the customer can be required to give at least the necessary account period, Avoid the large advance of the platform.
If the platform is connected to non core businesses or new pioneering businesses, it should be noted that not all big B customers are good for the good, and they may become a risk bearer of others' trial and error if they are not careful.
Operators need to pay attention to the common settlement management indicators of the entire platform, such as collection ratio, collection cycle, collection customer, cash flow inflow/outflow difference, collection amount, bad debt ratio, and bad debt reason.
Other quantitative operation indicators
Others:
The product indicators focus on the sales and usage of each product on the platform, and the products of competitors.
Channel indicators focus on channel revenue, conversion rate, cost, etc
The business opportunity indicator focuses on the opportunity cost and conversion rate of business opportunities.
Activity indicators focus on activity benefit, publicity effect, cost, transformation, etc
After sales indicators focus on customer complaints, service quality, etc.
To do B-end operation is to take the salary of selling cabbage and worry about selling white powder. The B-end operation work is in a myriad of threads. The key is to form a system, form indicators, and promote the work with goals, plans, and quantification. Let's encourage each other.
Author: Lao Ge


