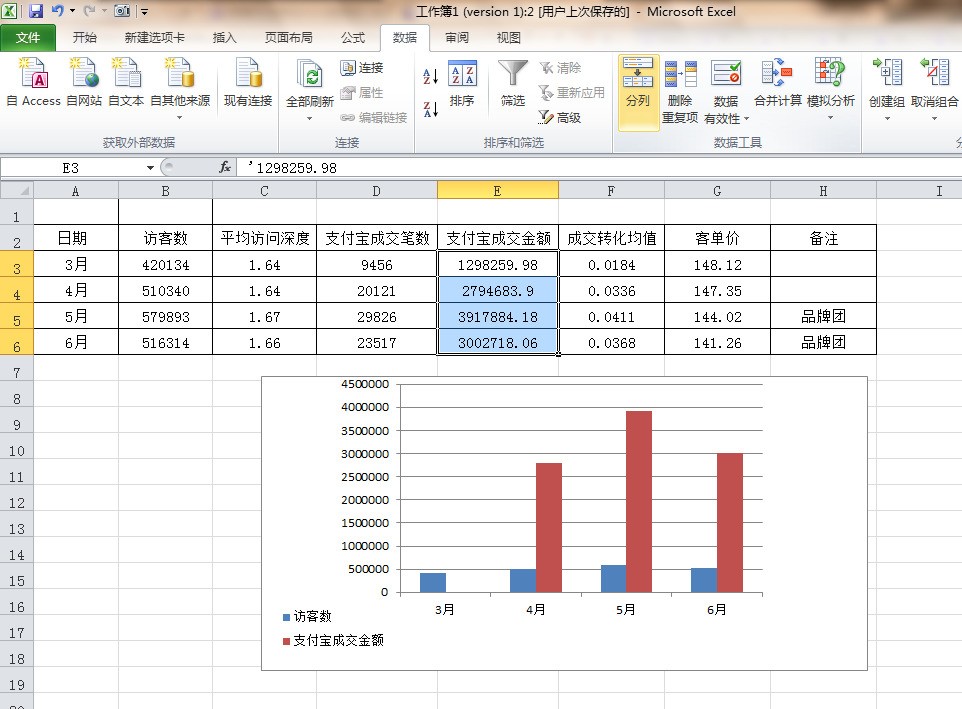
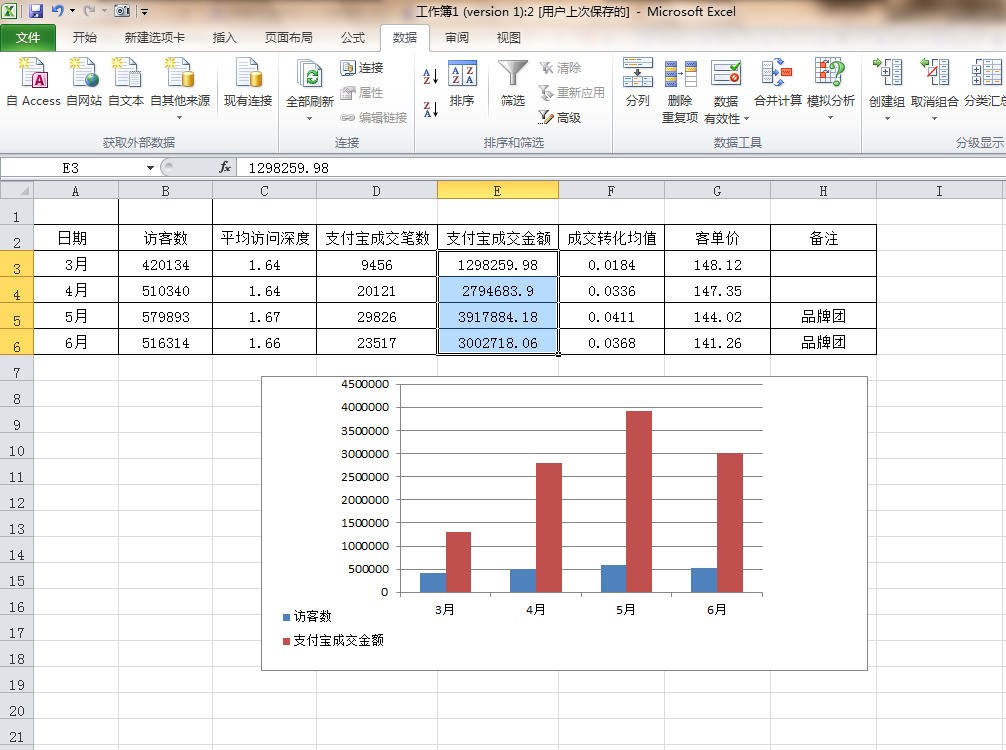
Suppose there is data in the table, but the chart does not show the graph that should be displayed; 1. Select the cell range where the graphic data is not displayed, go to the "Data" column, and click "Column"; See Figure 1 2. In the "Column" dialog box, click "Finish" directly; See Figure 2 3. Actual results: See Figure 3 Note: It seems that there is data in the table, but it is not displayed correctly in the graph. Generally, it means that the data in the table is not in the correct format. It may be text, or it may contain hidden characters. In this case, the text data can be changed back to the actual value by using the "column splitting" method.
Your data should be obtained by formula. If it is, you can change the place where 0 or empty is displayed in the formula to NA (), Then you can set the font color of # N/A to white, or use conditional format. When the cell value is # N/A, the font color is white
These data may contain other characters that are not visible.Is it exported from other software? In the normal format, you can enter values manually, which may be normal.