After layout, you need to add groups (right click -- Add Group: select 1~18). Each stock can't be grouped in the same group, and it will change when used. If it is grouped in the same group by default, the method is shown as follows:
1. Open the Tongdaxin stock quotation software and click the [Tools] above; 2. Select System Settings - Appearance; 3. Select [Graphic Text] in the [Appearance] menu, select the color in the [Color Scheme], and click [OK]; 4. If you are not satisfied, you can reset according to the above method.
The color of stock names can be set as follows: click "Tools" to find "System Settings" or press "Ctrl D" to pop up.Then a dialog box will appear. You can pull down the scroll bar and select "Headline", then select the color you want, and click OK
After layout, you need to add groups (right click - Add Group: select 1~18). Each stock cannot be in the same group. If it is in the same group by default, it will change simultaneously when used.
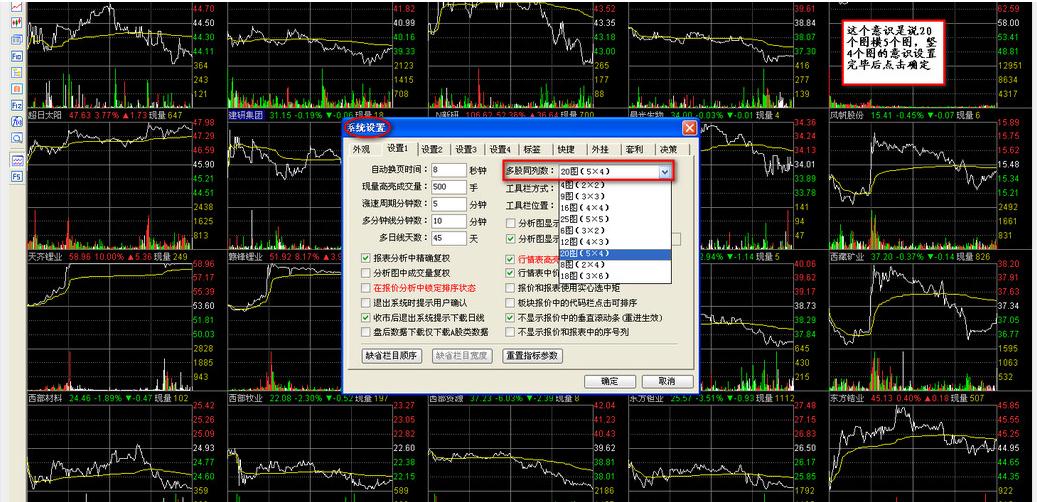
The K line method for displaying the analysis chart of Tongdaxin software on the specified date is on the [Analysis Chart Main Chart K Line] page, as shown below:
Right click and left click Lock Display Period in the pop-up menu, as shown in the following figure:
In the pop-up window, select the day after the end of the K line display in the analysis chart, and click OK.As shown below: