An official website of the United States government
Here's how you know
Official websites use .gov A.govwebsite belongs to an officialgovernment organization in the United States.
Secure .gov websites use HTTPS Alock() orhttps://means you've safelyconnected to the .gov website. Share sensitiveinformation only on official, secure websites.
As a library, NLM provides access to scientific literature. Inclusion in an NLM database does not imply endorsement of, or agreement with,the contents by NLM or the National Institutes of Health. Learn more:PMC Disclaimer|PMC Copyright Notice
. Author manuscript; available in PMC: 2023 Jan 22.
2School of Laboratory Medicine and Medical Sciences, University of KwaZulu–Natal, Durban, South Africa.
3KwaZulu–Natal Research Innovation and Sequencing Platform (KRISP), School of Laboratory Medicine and Medical Sciences, University of KwaZulu–Natal, Durban, South Africa.
4Department of Biochemistry and Molecular Biology, The Institute for Medical Research Israel–Canada, Hadassah Medical School, The Hebrew University of Jerusalem, Jerusalem, Israel.
3KwaZulu–Natal Research Innovation and Sequencing Platform (KRISP), School of Laboratory Medicine and Medical Sciences, University of KwaZulu–Natal, Durban, South Africa.
3KwaZulu–Natal Research Innovation and Sequencing Platform (KRISP), School of Laboratory Medicine and Medical Sciences, University of KwaZulu–Natal, Durban, South Africa.
3KwaZulu–Natal Research Innovation and Sequencing Platform (KRISP), School of Laboratory Medicine and Medical Sciences, University of KwaZulu–Natal, Durban, South Africa.
3KwaZulu–Natal Research Innovation and Sequencing Platform (KRISP), School of Laboratory Medicine and Medical Sciences, University of KwaZulu–Natal, Durban, South Africa.
3KwaZulu–Natal Research Innovation and Sequencing Platform (KRISP), School of Laboratory Medicine and Medical Sciences, University of KwaZulu–Natal, Durban, South Africa.
8;Network for Genomic Surveillance in South Africa*;COMMIT-KZN Team*,Richard J Lessells
Richard J Lessells
3KwaZulu–Natal Research Innovation and Sequencing Platform (KRISP), School of Laboratory Medicine and Medical Sciences, University of KwaZulu–Natal, Durban, South Africa.
6Centre for the AIDS Programme of Research in South Africa (CAPRISA), Durban, South Africa.
3KwaZulu–Natal Research Innovation and Sequencing Platform (KRISP), School of Laboratory Medicine and Medical Sciences, University of KwaZulu–Natal, Durban, South Africa.
6Centre for the AIDS Programme of Research in South Africa (CAPRISA), Durban, South Africa.
9Department of Global Health, University of Washington, Seattle, WA, USA.
1Africa Health Research Institute, Durban, South Africa.
2School of Laboratory Medicine and Medical Sciences, University of KwaZulu–Natal, Durban, South Africa.
3KwaZulu–Natal Research Innovation and Sequencing Platform (KRISP), School of Laboratory Medicine and Medical Sciences, University of KwaZulu–Natal, Durban, South Africa.
4Department of Biochemistry and Molecular Biology, The Institute for Medical Research Israel–Canada, Hadassah Medical School, The Hebrew University of Jerusalem, Jerusalem, Israel.
5Division of Infection and Immunity, University College London, London, UK.
6Centre for the AIDS Programme of Research in South Africa (CAPRISA), Durban, South Africa.
7Ragon Institute of MGH, Harvard and MIT, Cambridge, MA, USA.
8Department of Infectious Diseases, Nelson R. Mandela School of Clinical Medicine, University of KwaZulu–Natal, Durban, South Africa.
9Department of Global Health, University of Washington, Seattle, WA, USA.
10Max Planck Institute for Infection Biology, Berlin, Germany.
*
Lists of authors and their affiliations appear online.
Author contributionsA.S., T.d.O. and R.J.L. conceived the study with input from A.B.B. A.S., T.d.O., S.C., S.-H.H. and L.J. designed the study and experiments. S.C., I.G., J.G., Y.N., S.P. and A.S. performed experiments. A.S., T.d.O., S.C., H.T., E.W., G.L., M.-Y.S.M., B.I.G. and R.J.L. analysed and interpreted data. F.K., K.K., Y.G., M.B., B.I.G., M.-Y.S.M. and S.C. set up and managed the cohort. A.S., T.d.O., R.J.L., W.H., A.B.B. and S.C. prepared the manuscript with input from all authors.
Network for Genomic Surveillance in South Africa
Shareef Abrahams11, Luiz Carlos Junior Alcantara12, Arghavan Alisoltani-Dehkordi13,14, Mushal Allam15, Jinal N. Bhiman15,16, Mary-Ann Davies17,18, Deelan Doolabh19,Susan Engelbrecht20, Vagner Fonseca3, Marta Giovanetti12, Allison J. Glass16,21,Adam Godzik14, Dominique Goedhals22, Diana Hardie23, Marvin Hsiao23, Arash Iranzadeh14, Arshad Ismail15, Stephen Korsman23, Sergei L. Kosakovsky Pond24,Oluwakemi Laguda-Akingba11,25, Jose Lourenco26, Gert Marais23, Darren Martin19,27, Caroline Maslo28, Koleka Mlisana6,29, Thabo Mohale15, Nokukhanya Msomi30,31,Innocent Mudau19, Francesco Petruccione32,33, Wolfgang Preiser20, Emmanuel James San3, Bryan Trevor Sewell34, Lynn Tyers19, Gert Van Zyl20, Anne von Gottberg15,16,Sibongile Walaza15,35, Steven Weaver24, Constantinos Kurt Wibmer15,Carolyn Williamson6,19,23& Denis York36
11National Health Laboratory Service, Port Elizabeth, South Africa.12Laboratorio de Flavivirus, Fundacao Oswaldo Cruz, Rio de Janeiro, Brazil.13Division of Medical Virology, Department of Pathology, University of Cape Town, Cape Town, South Africa.14Division of Biomedical Sciences, University of California Riverside School of Medicine, Riverside, CA, USA.15National Institute for Communicable Diseases, National Health Laboratory Service, Johannesburg, South Africa.16School of Pathology, Faculty of Health Sciences, University of the Witwatersrand, Johannesburg, South Africa.17Centre for Infectious Disease Epidemiology and Research, University of Cape Town, Cape Town, South Africa.18Western Cape Government: Health, Cape Town, South Africa.19Division of Medical Virology, Institute of Infectious Disease and Molecular Medicine, University of Cape Town, Cape Town, South Africa.20Division of Medical Virology at NHLS Tygerberg Hospital, Faculty of Medicine and Health Sciences, Stellenbosch University, Cape Town, South Africa.21Department of Molecular Pathology, Lancet Laboratories, Johannesburg, South Africa.22Division of Virology, NHLS Universitas Academic Laboratories, University of The Free State, Bloemfontein, South Africa.23Division of Medical Virology, NHLS Groote Schuur Hospital, University of Cape Town, Cape Town, South Africa.24Institute for Genomics and Evolutionary Medicine, Temple University, Philadelphia, PA, USA.25Department of Laboratory Medicine and Pathology, Faculty of Health Sciences, Walter Sisulu University, Mthatha, South Africa.26Department of Zoology, University of Oxford, Oxford, UK.27Computational Biology Division, Department of Integrative Biomedical Sciences, University of Cape Town, Cape Town, South Africa.28Department of Quality Leadership, Netcare Hospitals, Johannesburg, South Africa.29National Health Laboratory Service, Johannesburg, South Africa.30Discipline of Virology, School of Laboratory Medicine and Medical Sciences, University of KwaZulu–Natal, Durban, South Africa.31Virology Department, Inkosi Albert Luthuli Central Hospital, National Health Laboratory Service, Durban, South Africa.32Centre for Quantum Technology, University of KwaZulu–Natal, Durban, South Africa.33National Institute for Theoretical Physics (NITheP), University of KwaZulu–Natal, Durban, South Africa.34Structural Biology Research Unit, Department of Integrative Biomedical Sciences, University of Cape Town, Rondebosch, South Africa.35School of Public Health, Faculty of Health Sciences, University of the Witwatersrand, Johannesburg, South Africa.36Molecular Diagnostics Services, Durban, South Africa.
37Department of Paediatrics and Child Health, University of KwaZulu–Natal, Durban, South Africa.38Department of Cardiothoracic Surgery, University of KwaZulu–Natal, Durban, South Africa.39Department of Paediatrics, University of Oxford, Oxford, UK.40Institute for Global Health, University College London, London, UK.41Department of Neurosurgery, University of KwaZulu–Natal, Durban, South Africa.42South African Population Research Infrastructure Network, Durban, South Africa.43Institute of Child Health, University College London, London, UK.44Department of Immunology and Microbiology, University of Copenhagen, Copenhagen, Denmark.45College of Health Sciences, University of KwaZulu–Natal, Durban, South Africa.46HIV Pathogenesis Programme, The Doris Duke Medical Research Institute, University of KwaZulu–Natal, Durban, South Africa.47Department of Pulmonology and Critical Care, University of KwaZulu–Natal, Durban, South Africa.48Department of Neurology, University of KwaZulu–Natal, Durban, South Africa.49Division of Infectious Diseases, University of Alabama at Birmingham, Birmingham, AL, USA.
✉
Correspondence and requests for materialsshould be addressed to T.d.O. or A.S.deoliveira@ukzn.ac.za;alex.sigal@ahri.org
The publisher's version of this article is available atNature
Abstract
SARS-CoV-2 variants of concern (VOC) have arisen independently at multiple locations1,2and may reduce the efficacy of current vaccines that target the spike glycoprotein of SARS-CoV-23. Here, using a live-virus neutralization assay, we compared the neutralization of a non-VOC variant with the 501Y.V2 VOC (also known as B.1.351) using plasma collected from adults who were hospitalized with COVID-19 during the two waves of infection in South Africa, the second wave of which was dominated by infections with the 501Y.V2 variant. Sequencing demonstrated that infections of plasma donors from the first wave were with viruses that did not contain the mutations associated with 501Y.V2, except for one infection that contained the E484K substitution in the receptor-binding domain. The 501Y.V2 virus variant was effectively neutralized by plasma from individuals who were infected during the second wave. The first-wave virus variant was effectively neutralized by plasma from first-wave infections. However, the 501Y.V2 variant was poorly cross-neutralized by plasma from individuals with first-wave infections; the efficacy was reduced by 15.1-fold relative to neutralization of 501Y.V2 by plasma from individuals infected in the second wave. By contrast, cross-neutralization of first-wave virus variants using plasma from individuals with second-wave infections was more effective, showing only a 2.3-fold decrease relative to neutralization of first-wave virus variants by plasma from individuals infected in the first wave. Although we tested only one plasma sample from an individual infected with a SARS-CoV-2 variant with only the E484K substitution, this plasma sample potently neutralized both variants. The observed effective neutralization of first-wave virus by plasma from individuals infected with 501Y.V2 provides preliminary evidence that vaccines based on VOC sequences could retain activity against other circulating SARS-CoV-2 lineages.
Through genomic surveillance of SARS-CoV-2, a number of new variants have been identified with multiple mutations in the spike glycoprotein. We recently described the emergence of the 501Y.V2 variant in South Africa, which is characterized by substitutions (K417N, E484K and N501Y) in the receptor-binding domain (RBD) of the spike protein as well as by substitutions and a deletion in the N-terminal domain (NTD)1. This variant was first detected in October 2020, and has rapidly become the dominant variant in South Africa with a frequency in January 2021 of 97% according to GISAID (https://www.gisaid.org/hcov19-mutation-dashboard/).
The RBD is the main target of neutralizing antibodies elicited by infection with SARS-CoV-2, with the remaining activity directed against the NTD4,5. All three amino acid residues associated with the substitutions in the RBD in 501Y.V2 interact directly with the human angiotensin-converting enzyme 2 (ACE2) receptor6. The E484 residue specifically is a hotspot for the binding of highly potent neutralizing antibodies6. In a number of separate in vitro studies using monoclonal antibodies, mutations that cause substitutions at E484 have emerged as immune escape mutations and conferred broad cross-resistance to panels of monoclonal antibodies and to convalescent plasma neutralization7–10. The E484K substitution also emerged during the passaging of live SARS-CoV-2 in Vero E6 cells in the presence of convalescent plasma, leading to a substantial reduction in neutralization11. Using a deep mutation-scanning approach to determine the effect of individual mutations on neutralization by polyclonal sera, substitutions at E484 were associated with the largest decreases in neutralization12.
South Africa has experienced two waves of SARS-CoV-2 infections to date (https://coronavirus.jhu.edu/map.html). The first wave peaked in July 2020 and consisted of viral variants that usually showed the D614G substitution but had none of the defining mutations of 501Y. V2. These variants have been almost completely replaced by 501Y.V2 variants in the second wave of infections in South Africa, which peaked in January 2021.
Coinciding with our initial report, there have been multiple studies that showed that 501Y.V2 decreases the neutralization capacity of polyclonal antibodies that have been elicited by infection with non-VOC SARS-CoV-2 or by vaccination13–22. This decrease ranges from relatively moderate13–16to severe17–22. Notably, three clinical trials performed in South Africa during the second wave, which include infections with 501Y.V2, reported considerable decreases in vaccine efficacy. The NVX-CoV2373 subunit vaccine (Novavax) showed a decrease in efficacy from 89.3% to 49.4% (https://ir.novavax.com/news-releases/news-release-details/novavax-covid-19-vaccine-demonstrates-893-efficacy-uk-phase-3). This trial also reported no differences in infection frequency between SARS-CoV-2-seropositive and SARS-CoV-2-seronegative participants in the placebo arm, indicating that infection with variants other than 501Y.V2 does not protect against re-infection with 501Y.V2. Details of the seroprevalence testing are not available at the time of publication of this study. The adenovirus-vectored single-dose vaccine (Johnson and Johnson) showed a reduced efficacy from 72% in the USA to 57% in South Africa (https://www.jnj.com/johnson-johnson-announces-single-shot-janssen-covid-19-vaccine-candidate-met-primary-endpoints-in-interim-analysis-of-its-phase-3-ensemble-trial). Importantly, the ChAdOx1 AZD1222 chimpanzee adenovirus-vectored vaccine (AstraZeneca) showed only 10% efficacy against the 501Y.V2 variant, compared with an efficacy of 75% against earlier variants in South Africa3. The rollout of this vaccine in South Africa is currently paused.
Here, using a live-virus neutralization assay, we measured the degree to which the 501Y.V2 virus variant compromises neutralization elicited by natural infection with variants other than 501Y.V2 circulating in South Africa. We also measured the degree to which the earlier variants could escape the neutralizing response elicited by 501Y.V2 virus (Fig. 1a). We used plasma samples from our ongoing longitudinal cohort that tracks cases of COVID-19 who were enrolled at hospitals in Durban, South Africa23. We sampled participants weekly for the first month after enrolment. At each time point, a blood draw and combined nasopharyngeal and oropharyngeal swab were performed to obtain both plasma and the infecting virus. Swabs positive for SARS-CoV-2 were sequenced.
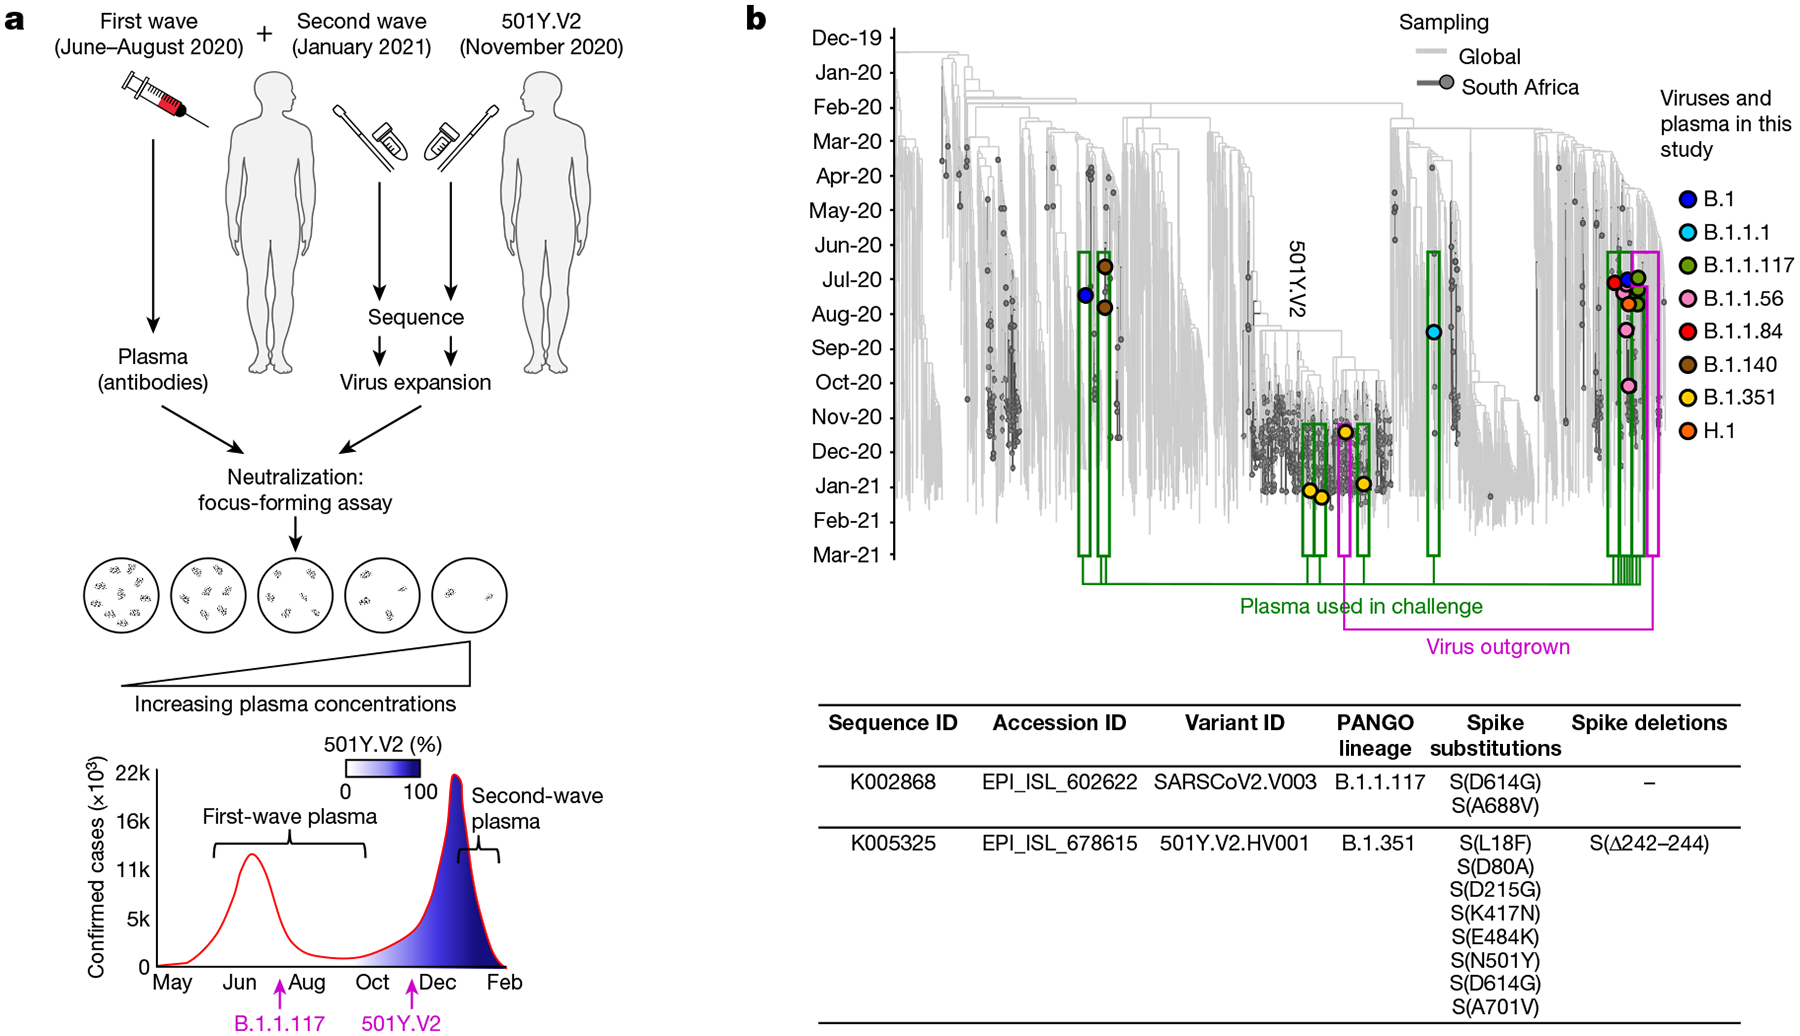
Fig. 1 |. Study design and sequences of SARS-CoV-2 variants.
a, We obtained convalescent plasma and sequenced the matching infecting virus from individuals with COVID-19 during the first and second waves of SARS-CoV-2 infections in South Africa. A variant that lacked the mutations in the RBD and NTD of 501Y.V2 was expanded from one participant infected in the first wave of infections in South Africa, and 501Y.V2 was expanded from a participant at the beginning of the second wave. Live-virus neutralization was assessed using a focus-forming assay. Conditions were: neutralization of non-VOC virus by plasma elicited against first-wave, non-VOC virus, neutralization of 501Y.V2 virus by plasma elicited against 501Y.V2 virus, neutralization of 501Y.V2 virus by plasma elicited against first-wave non-VOC virus, and neutralization of non-VOC virus by plasma elicited against 501Y.V2.b, Top, phylogenetic relationships and mutations in the virus sequences. Variants that elicited the antibody immunity in the plasma samples are highlighted in green boxes. Variants that were expanded are highlighted in magenta boxes. Theyaxis denotes the time of sampling. Bottom, substitutions and deletions that are present in the spike protein of the SARS-CoV-2 expanded variants used in the live-virus neutralization assay. SeeSupplementary Table 1for a complete list of mutations in the viral genomes of variants that elicited plasma immunity and the expanded variants.
We chose plasma from 14 participants from the first wave of infections in South Africa for whom the infecting virus was successfully sequenced (Methods). Plasma samples were from blood drawn approximately one month after the onset of symptoms (Extended Data Table 1), close to the peak in the antibody response24. Of the 14 participants, 13 did not show mutations in the RBD or NTD of the infecting virus. A single participant sampled in October 2020 showed the escape mutation that leads to the E484K substitution in the absence of the other changes associated with 501Y.V2 (Supplementary Table 1). We had fewer participants from the second wave of infection at the time of writing as most participants had not yet reached the time point for sampling of one month after the onset of symptoms. The participants from the second wave in this study were infected in late December 2020 or early January 2021 (Fig. 1bandExtended Data Table 1). We were able to sequence the virus from three participants of the second wave for which the obtained sequences enabled variant calling, two of which had good coverage of the spike gene (Fig. 1bandSupplementary Table 1). In all cases, the infecting variant was 501Y.V2. It is extremely likely that 501Y. V2 was also the infecting variant for the rest of the participants from the second wave of infections, given the complete dominance of this variant in January 2021. For each participant from the second wave, our clinical team conducted a telephone interview and examined clinical records to determine whether the participant was also infected during the first wave of infections in South Africa. None of the participants showed evidence of being previously infected.
We expanded a first-wave virus (Methods) from one participant during the first wave of infections as well as a 501Y.V2 virus from a sample obtained during the second wave in November 2020 through our genomic surveillance programme (Fig. 1b). We used a microneutralization live-virus focus-forming assay25, which relies on a methylcellulose overlay to limit cell-free spread of the virus. This results in a local infection focus that represents one infectious unit of the virus. The focus is detected by an anti-SARS-CoV-2 spike antibody (Methods). We normalized the number of foci to the number of foci in the absence of plasma on the same plate to obtain the transmission index (Tx)26. This controls for the experimental variability in the input virus dose between experiments. We mixed the virus with serially diluted plasma, then added the mixture to Vero E6 cells and counted the number of infection foci after 28 h using automated image analysis (Fig. 2a,MethodsandExtended Data Fig. 1a).
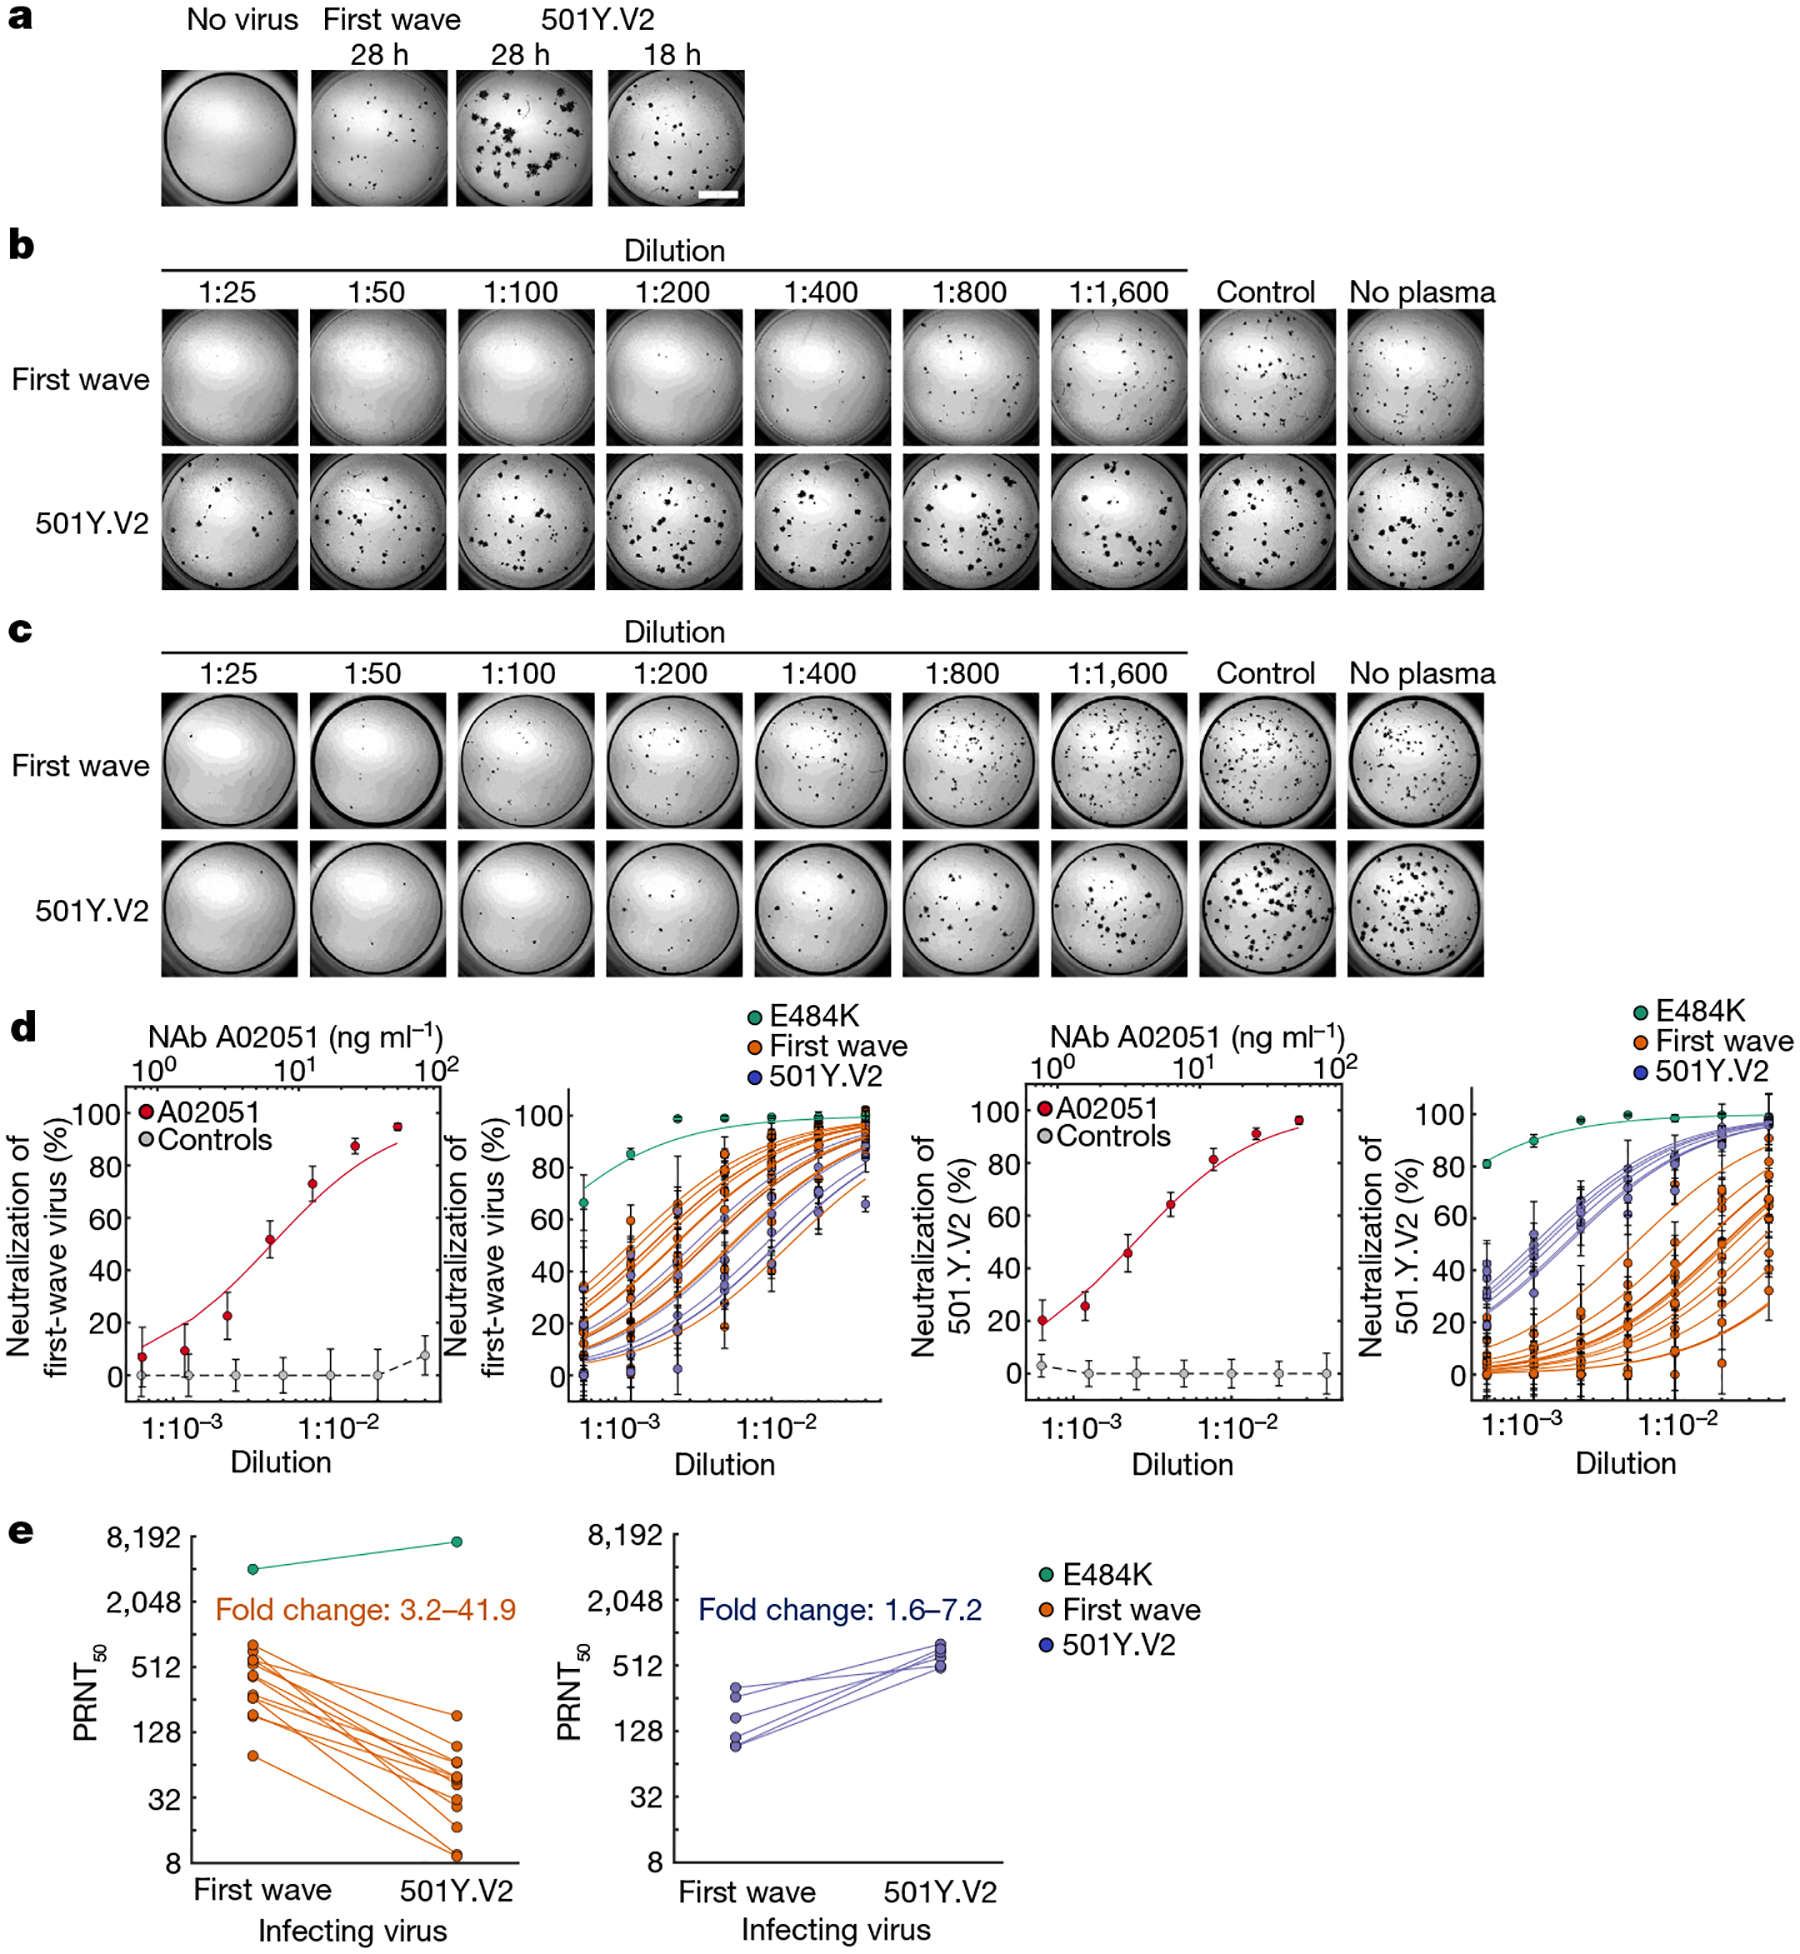
Fig. 2 |. Neutralization of first-wave and 501Y.V2 variants by convalescent plasma elicited by first-wave and 501Y.V2 infections.
a, Focus formation by first-wave and 501Y.V2 virus variants. To obtain similar focus sizes, the incubation time with 501Y.V2 was reduced to 18 h. Scale bar, 2 mm.b,c, A representative focus-forming assay using plasma from participant 039-13-0015, who was infected with a first-wave variant (b), and participant 039-02-0033, who was infected with 501Y.V2 (c). Columns are plasma dilutions—which range from 1:25 to 1:1,600—a plasma pool from three uninfected individuals (control) and a no-plasma control (no plasma).d, Quantified neutralization per participant for the first-wave virus variants (left two plots) and 501Y.V2 (right two plots). Red points are neutralization by the A02051 neutralizing antibody (NAb), grey points show neutralization by the plasma pool from uninfected individuals (control), green points indicate neutralization by plasma from the participant who was infected with the S(E484K)-mutant virus, orange points are neutralization by plasma from participants who were infected by first-wave variants, and blue points are neutralization by plasma from participants who were infected with 501Y.V2. Data are mean and s.e.m. of 3–4 independent experiments per plasma sample of participants convalescing from infection with the first-wave (n= 14) or 501Y.V2 (n= 6) virus variants or 10 independent experiments for A02051 and uninfected plasma controls. Solid lines of the corresponding colour are fitted values using a sigmoidal equation. From left to right, the plots show the following analyses. First plot, neutralization of the first-wave virus by the neutralizing antibody A02051 (PRNT50= 6.5 ng ml−1; 95% confidence intervals, 3.9–9.1 ng ml−1) and control plasma. Second plot, neutralization of first-wave virus by plasma from participants convalescing from infection with first-wave or 501Y.V2 viruses. Third plot, neutralization of the 501Y.V2 variant by the neutralizing antibody A02051 (PRNT50= 3.5 ng ml−1(2.9–4.1 ng ml−1)) and control plasma. Fourth plot, neutralization of the 501Y.V2 variant by plasma from participants convalescing from infection with first-wave or 501Y.V2 viruses.e, Decrease in PRNT50in cross-neutralization. Left, neutralization of first-wave or 501Y.V2 virus variants by first-wave plasma. Right, neutralization of 501Y.V2 or first-wave virus variants by second-wave plasma. The fold change was calculated as PRNT50of the homologous virus/PRNT50of the heterologous virus and ranged from 3.2 to 41.9 for first-wave plasma, and from 1.6 to 7.2 for second-wave plasma. The fold change in PRNT50elicited by the S(E484K)-mutant virus was excluded.
There was a clear reduction in the neutralization capacity of plasma from participants with first-wave infections against 501Y.V2 relative to the neutralization of the homologous, first-wave variant (Extended Data Fig. 1). 501Y.V2 also showed larger foci, which is probably caused by a larger number of cells being infected by one infected cell or by more rapid infection cycles (Fig. 2a,Extended Data Fig. 1a). To compare foci of a similar size, we reduced the incubation time of cells infected with 501Y.V2 to 18 h (Fig. 2a). To investigate whether plasma from first-wave samples had any effects on the 501Y.V2 variant, we tested more-concentrated plasma (Fig. 2b). To rule out infection-saturation effects, we obtained a positive-control monoclonal antibody with a similar neutralization efficacy against first-wave and 501Y.V2 variants. We then repeated the experiments (Extended Data Figs. 2–4show representative neutralization experiments for plasma from each participant).
We observed the same trend in neutralization capacity as with the first set of experiments: there was a decrease in the number of foci when plasma elicited against first-wave infections was added to the homologous, first-wave virus. This decrease was strongly attenuated in neutralization of the 501Y.V2 variant (Fig. 2b). When second-wave, 501Y.V2-elicited plasma was used, it effectively neutralized the homologous, 501Y.V2 variant (Fig. 2c). In contrast to plasma elicited against first-wave variants, substantial cross-neutralization of first-wave virus was observed with second-wave, 501Y.V2-elicited plasma. Some of the foci of the first-wave variant were smaller at higher antibody concentrations (Fig. 2candExtended Data Figs. 2–4), which is possibly indicative of some antibody-mediated reduction in cell-to-cell spread in the Vero E6 cell line.
The data from the focus-forming assay at each dilution approximated a normal distribution (Extended Data Fig. 5) and we therefore used parametric statistics to describe these data. We fitted the data for each participant to a sigmoidal function27with the dilution required to inhibit 50% of the infection (ID50) as the only free parameter (Methods). For clarity, we plotted the data for each neutralization experiment as the percentage neutralization17((1 − Tx) × 100%) (Methods), with neutralization represented by the 50% plaque reduction neutralization titre16(PRNT50), the reciprocal of the ID50.
The Genscript BS-R2B2 rabbit monoclonal neutralizing antibody (hereafter referred to by its catalogue number, A02051) was used as a positive control in each experiment (Extended Data Figs. 2–4). This antibody showed a similar neutralization response between variants (Fig. 2d) and was used to test that the number and size of the foci were not saturating in each experiment. We also used a plasma pool from three study participants who did not have any indications of infection with SARS-CoV-2, and this plasma pool did not appreciably neutralize either variant (Fig. 2d).
We then quantified the neutralization of the homologous virus as well as cross-neutralization between variants. Infection with the first-wave virus was neutralized by plasma elicited by first-wave virus variants, with some variability in neutralization capacity between participants who had been infected with a first-wave variant. The first-wave virus was also cross-neutralized by second-wave, 501Y.V2-elicited plasma (Fig. 2d). There was overlap between the neutralization capacity of the non-VOC variant by plasma induced by infection with first-wave and second-wave viruses. By contrast, when the 510Y.V2 variant was used as the infecting virus, there was a clear separation between the neutralization capacity of plasma from the homologous second wave (Fig. 2d) compared with plasma from the heterologous first wave. Whereas the homologous plasma effectively neutralized the 501Y.V2 variant, cross-neutralization mediated by plasma elicited by first-wave variants was weaker, which is consistent with what is apparent when viewing the raw number of foci (Fig. 2bandExtended Data Figs. 2–4). Plasma elicited by the variant with the E484K substitution alone showed a much stronger neutralization efficacy of both the first-wave and 501Y. V2 virus variants relative to any of the other plasma samples (Fig. 2d).
The PRNT50values showed a strong reduction in cross-neutralization by first-wave plasma of the 501Y.V2 virus (Fig. 2e). Excluding the plasma elicited by the virus with the E484K substitution alone, which showed a very high PRNT50for both variants, the PRNT50of plasma elicited by first-wave virus infections decreased by between 3.2- and 41.9-fold against the 501Y.V2 variant relative to the non-VOC virus. By contrast, the decrease in PRNT50in cross-neutralization of the first-wave virus by second-wave, 501Y.V2-elicited plasma was more attenuated. In this case, the decrease ranged between 1.6- and 7.2-fold relative to the homologous 501Y.V2 virus (Fig. 2e).
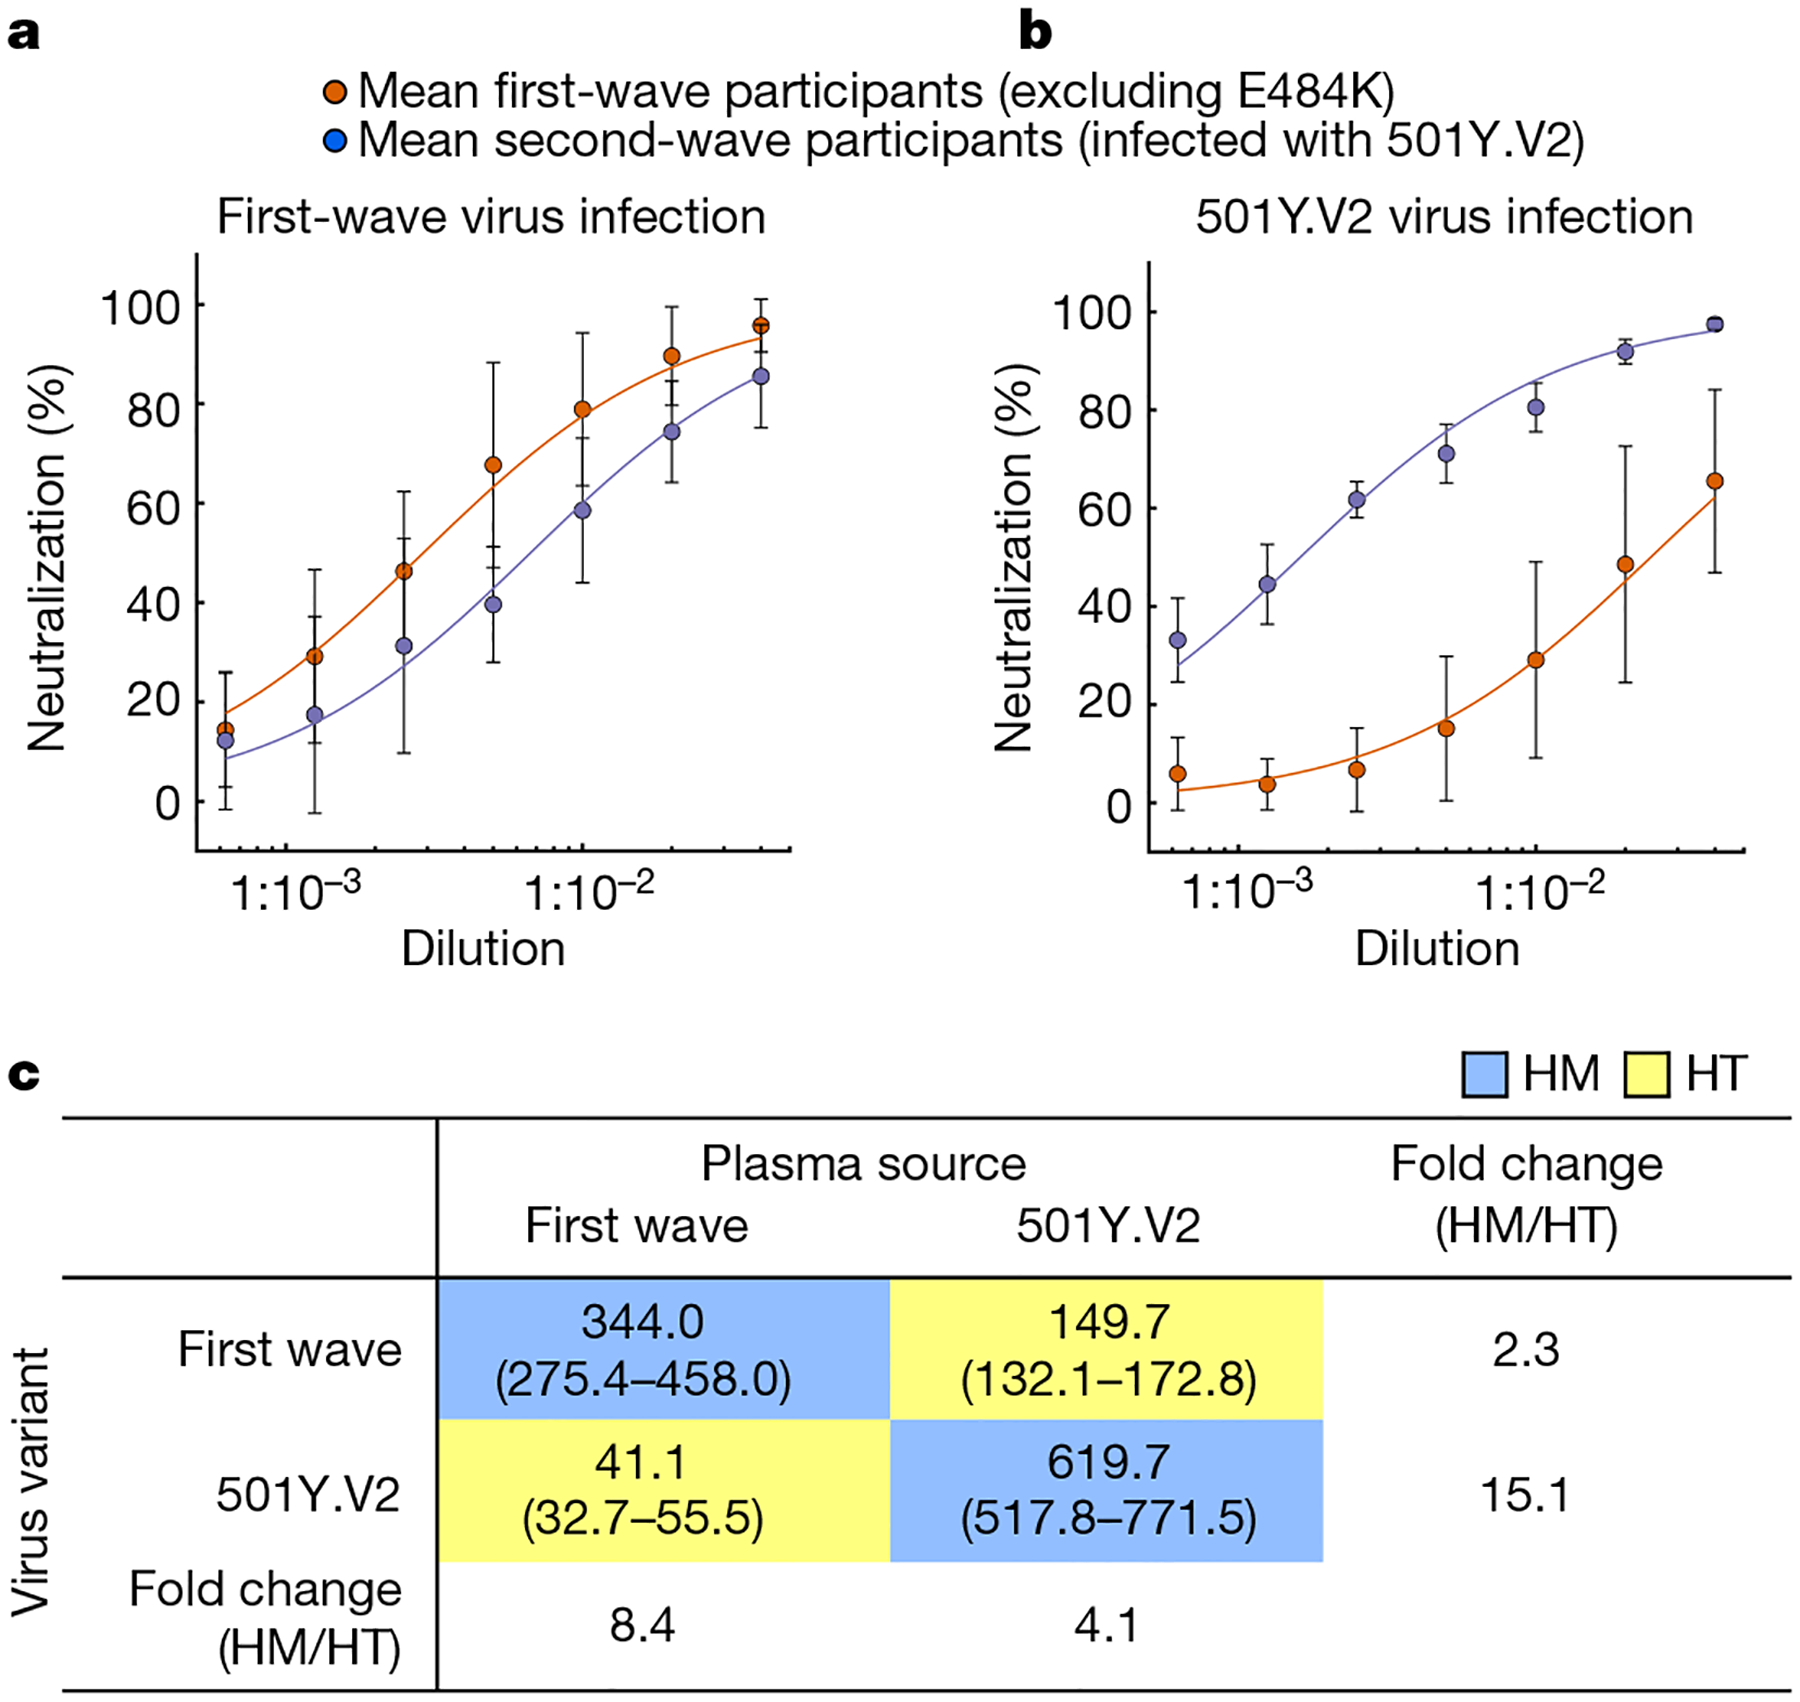
As the data approximated a normal distribution (Extended Data Fig. 5), we derived the mean neutralization between participants infected with first-wave (excluding the plasma elicited by the E484K-only virus) and second-wave virus variants (Fig. 3). In both cases, neutralization showed a separation across all dilutions tested between the homologous and heterologous virus variants, for which cross-neutralization was always lower than neutralization of the virus from the same wave (Fig. 3a,b). However, the separation was less pronounced for the cross-neutralization of first-wave virus by 501Y.V2-elicited plasma (Fig. 3a) relative to cross-neutralization of 501Y.V2 virus by first-wave plasma (Fig. 3b). To quantify the homologous versus cross-neutralization capacity, we repeated the sigmoidal fit to the combined participant means and obtained the combined PRNT50. For neutralization of first-wave virus with first-wave plasma, the PRNT50was 344.0 (fit 95% confidence intervals, 275.4–458.0) (Fig. 3c, top left blue entry). For neutralization of the homologous, 501Y.V2 virus with second-wave plasma (Fig. 3c, bottom right blue entry), the PRNT50was 619.7 (517.8–771.5). Therefore, 501Y. V2 elicited a robust antibody response in the participants tested. For cross-neutralization, neutralization of 501Y.V2 virus by first-wave plasma (Fig. 3c, bottom left yellow entry) was strongly attenuated across participants, with PRNT50= 41.1 (32.7–55.5). By contrast, cross-neutralization of first-wave virus by second-wave plasma (Fig. 3c, top right yellow entry) was more effective at PRNT50= 149.7 (132.1–172.8). The 95% confidence intervals did not overlap between any of the conditions.
Fig. 3 |. Cross-neutralization of first infection wave and 501Y.V2 virus across all participants.
Neutralization of the virus from the first wave (a) or 501Y.V2 (b). Sigmoidal fits were performed to the means of plasma neutralization results from the first wave (red points) and second wave (blue points) across all participants excluding a participant with plasma immunity elicited by SARS-CoV-2 with only the E484K substitution. Data are mean ± s.d. ofn= 13 plasma donors infected with a first-wave virus andn= 6 plasma donors infected with a second-wave virus.c, Plasma PRNT50as a function of plasma source (columns) and infecting viral variant (rows). Blue rectangles highlight homologous (HM) neutralization for which virus and infection wave are matched; yellow rectangles highlight heterologous, cross-neutralization (HT) for which virus and plasma are from different infection waves.
The fold decrease in neutralization of 501Y.V2 by first-wave plasma compared to the homologous first-wave virus was 8.4. The fold decrease in neutralization of first-wave virus by second-wave plasma compared to the homologous virus was 4.1. However, the absolute neutralization capacity of 501Y.V2-elicited plasma against the first-wave virus decreased by only 2.3-fold compared with the capacity of first-wave plasma. By contrast, the absolute neutralization capacity decreased by 15.1-fold when 501Y.V2 was cross-neutralized by first-wave plasma (Fig. 3).
The importance of these results is that 501Y.V2 is poorly neutralized by plasma elicited by non-VOC virus. However, plasma elicited by infection with 501Y.V2 not only effectively neutralized the 501Y.V2 virus, but also more successfully cross-neutralized the earlier variant (Fig. 2). This level of cross-neutralization is within the lower part of the neutralization capacity range elicited by the BNT162b2 mRNA vaccine (Pfizer)13,14,16. Owing to the potentially higher immunogenicity of the 501Y.V2 variant indicated by the high PRNT50of 501Y.V2-elicited plasma, this plasma does not greatly underperform compared with the plasma elicited by earlier variants of SARS-CoV-2 when neutralizing these earlier variants.
The larger focus size of the 501Y.V2 variant relative to first-wave virus variants is unlikely to influence results. We performed 501Y.V2 infections with larger foci using the same infection incubation time as the first-wave virus as well as 501Y.V2 infections with a focus size that was similar to the first-wave virus using a shorter incubation time of 501Y. V2 infection. The results showed similar trends. Furthermore, neutralization by the monoclonal antibody control indicated that the system could effectively read out unsaturated neutralization for both variants (Fig. 2dandExtended Data Figs. 2–4). 501Y.V2 variants vary in some of their mutations. The variant that we used has an L18F substitution in the NTD that currently occurs in about a quarter of the 501Y.V2 variants (GISAID). Other 501Y.V2 mutation patterns require further investigation. An important question in the interpretation of the results is whether the participants infected during the second wave were also infected during the first wave of infections. Our clinical team conducted telephone interviews and investigated the clinical charts and found no evidence of a previous SARS-CoV-2 infection. Although a previous infection could still be missed despite these measures, we believe it is unlikely to have occurred in all of the participants with a second-wave infection. Furthermore, although we and others have measured plasma neutralization, how well this correlates with protection against SARS-CoV-2 at the mucosal surface where the initial infection takes place remains unclear.
The plasma elicited by the virus with the E484K substitution alone showed the strongest neutralization against both the first-wave and 501Y.V2 virus variants relative to any of the other plasma samples that we tested (Fig. 2). Because we only found one participant in this category, this result is difficult to interpret: it may be due to the high immunogenicity of the mutant or because of participant-specific factors. Our clinical data do not show prolonged SARS-CoV-2 shedding in this participant or other any unusual features (Extended Data Table 1). This result highlights the importance of sequencing the infecting virus and requires further investigation.
The recent results from the vaccine trials of Novavax, Johnson and Johnson and AstraZeneca in South Africa indicate that the 501Y.V2 variant may lead to a decrease in vaccine efficacy. The loss of neutralization capacity against infection with 501Y.V2 that we quantified among the vaccinated participants in the AstraZeneca trial3shows that loss of neutralization may be associated with a loss of vaccine efficacy. Loss of vaccine efficacy may also be mediated by escape from T cell immunity, although this is less likely because of the diversity of HLA alleles in the population, which may curtail the ability of an escape variant that evolved in one individual to escape T cell immunity in another28. If the loss of vaccine efficacy proves to require vaccine redesign, the results presented here may be the first indication that a vaccine designed to target 501Y.V2 may also be effective at targeting other SARS-CoV-2 variants.
Online content
Any methods, additional references, Nature Research reporting summaries, source data, extended data, supplementary information, acknowledgements, peer review information; details of author contributions and competing interests; and statements of data and code availability are available athttps://doi.org/10.1038/s41586-021-03471-w.
Methods
Data reporting
No statistical methods were used to predetermine sample size. The experiments were not randomized and the investigators were not blinded to allocation during experiments and outcome assessment.
Ethical statement
Nasopharyngeal and oropharyngeal swab samples and plasma samples were obtained from 20 hospitalized adults with PCR-confirmed SARS-CoV-2 infection who were enrolled in a prospective cohort study approved by the Biomedical Research Ethics Committee (BREC) at the University of KwaZulu–Natal (reference BREC/00001275/2020). The 501Y.V2 variant was obtained from a residual nasopharyngeal and oropharyngeal sample used for routine SARS-CoV-2 diagnostic testing by the National Health Laboratory Service through our SARS-CoV-2 genomic surveillance programme (BREC approval reference BREC/00001510/2020).
Whole-genome sequencing, genome assembly and phylogenetic analysis
DNA synthesis was performed on the extracted RNA using random primers followed by gene-specific multiplex PCR using the ARTIC V.3 protocol (https://www.protocols.io/view/covid-19-artic-v3-illumina-library-construction-an-bibtkann). In brief, extracted RNA was converted to cDNA using the Superscript IV First Strand synthesis system (Life Technologies) and random hexamer primers. SARS-CoV-2 whole-genome amplification was performed by multiplex PCR using primers designed using Primal Scheme (http://primal.zibraproject. org/) to generate 400-bp amplicons with an overlap of 70 bp that covers the 30 kb SARS-CoV-2 genome. PCR products were cleaned up using AmpureXP purification beads (Beckman Coulter) and quantified using the Qubit dsDNA High Sensitivity assay on the Qubit 4.0 instrument (Life Technologies). We then used the Illumina Nextera Flex DNA Library Prep kit according to the manufacturer’s protocol to prepare indexed paired-end libraries of genomic DNA. Sequencing libraries were normalized to 4 nM, pooled and denatured with 0.2 N sodium acetate. Then, a 12-pM sample library was spiked with 1% PhiX (a PhiX Control v.3 adaptor-ligated library was used as a control). We sequenced libraries on a 500-cycle v.2 MiSeq Reagent Kit on the Illumina MiSeq instrument (Illumina). We assembled paired-end fastq reads using Genome Detective 1.126 (https://www.genomedetective.com) and the Coronavirus Typing Tool. We polished the initial assembly obtained from Genome Detective by aligning mapped reads to the reference sequences and filtering out low-quality mutations using the bcftools 1.7–2 mpileup method. Mutations were confirmed visually with BAM files using Geneious software (Biomatters). All of the sequences were deposited in GISAID (https://www.gisaid.org/). We retrieved all SARS-CoV-2 genotypes from South Africa from the GISAID database as of 11 January 2021 (n= 2,704). We initially analysed genotypes from South Africa against the global reference dataset (n= 2,592) using a custom pipeline based on a local version of NextStrain. The pipeline contains several Python scripts that manage the analysis workflow. It performs alignment of genotypes in MAFFT, phylogenetic tree inference in IQ-Tree20, tree dating and ancestral state construction and annotation (https://github.com/nextstrain/ncov).
Cells
Vero E6 cells (ATCC CRL-1586, obtained from Cellonex in South Africa) were propagated in complete DMEM with 10% fetal bovine serum (Hylone) containing 1% each of HEPES, sodium pyruvate,l-glutamine and nonessential amino acids (Sigma-Aldrich). Vero E6 cells were passaged every 3–4 days. H1299 cells were propagated in complete RPMI with 10% fetal bovine serum containing 1% each of HEPES, sodium pyruvate,l-glutamine and nonessential amino acids. H1299 cells were passaged every second day. HEK-293 (ATCC CRL-1573) cells were propagated in complete DMEM with 10% fetal bovine serum containing 1% each of HEPES, sodium pyruvate,l-glutamine and nonessential amino acids. HEK-293 cells were passaged every second day. Cell lines have not been authenticated. The cell lines have been tested for mycoplasma contamination and are mycoplasma negative.
H1299-E3 cell line for first-passage SARS-CoV-2 expansion
The H1299-H2AZ clone with nuclear-labelled YFP was constructed to overexpress human ACE2 as follows. Vesicular stomatitis virus G protein (VSVG)-pseudotyped lentivirus containing the human ACE2 was generated by co-transfecting HEK-293T cells with the pHAGE2-EF1alnt-ACE2-WT plasmid along with the lentiviral helper plasmids HDM-VSVG, HDM-Hgpm2, HDM-tat1b and pRC-CMV-Rev1b using the TransIT-LT1 (Mirus) transfection reagent. Supernatant containing the lentivirus was collected 2 days after infection, filtered through a 0.45-μm filter (Corning) and used to spinfect H1299-H2AZ at 1,000 rcf for 2 h at room temperature in the presence of 5 μg ml−1polybrene (Sigma-Aldrich). ACE2-transduced H1299-H2AZ cells were then subcloned at single-cell density in 96-well plates (Eppendorf) in conditioned medium derived from confluent cells. After 3 weeks, wells were trypsinized (Sigma-Aldrich) and plated in two replicate plates. The first plate was used to determine infectivity and the second plate was used as stock. The first plate was screened for the fraction of mCherry-positive cells per cell clone after infection with SARS-CoV-2 mCherry-expressing spike-pseudotyped lentiviral vector 1610-pHAGE2/EF1a Int-mCherry3-W produced by transfecting the cells as described above. Screening was performed using a Metamorph-controlled (Molecular Devices) Nikon TiE motorized microscope (Nikon Corporation) with a 20×/0.75 NA phase objective, 561 laser line, and 607-nm emission filter (Semrock). Images were captured using an 888 EMCCD camera (Andor). Temperature (37°C), humidity and CO2(5%) were controlled using an environmental chamber (OKO Labs). The clone with the highest fraction of mCherry expression was expanded from the stock plate and denoted H1299-E3. This clone was used in the expansion assays.
Virus expansion
All work with live virus was performed in Biosafety Level 3 containment using protocols for SARS-CoV-2 approved by the Africa Health Research Institute Biosafety Committee. For first-wave virus, a T25 flask (Corning) was seeded with Vero E6 cells at 2 × 10⁵cells per ml and incubated for 18–20 h. After one DPBS wash, the subconfluent cell monolayer was inoculated with 500 μl universal transport medium diluted 1:1 with growth medium and filtered through a 0.45-μm filter. Cells were incubated for 1 h. The flask was then filled with 7 ml of complete growth medium and checked daily for cytopathogenic effects. After infection for 4 days, supernatants of the infected culture were collected, centrifuged at 300 rcf for 3 min to remove cell debris and filtered using a 0.45-μm filter. Viral supernatant was aliquoted and stored at −80°C. For 501Y.V2 variants, we used ACE2-expressing H1299-E3 cells for the initial isolation followed by passaging in Vero E6 cells. ACE2-expressing H1299-E3 cells were seeded at 1.5 × 10⁵cells per ml and incubated for 18–20 h. After one DPBS wash, the subconfluent cell monolayer was inoculated with 500 μl universal transport medium diluted 1:1 with growth medium and filtered through a 0.45-μm filter. Cells were incubated for 1 h. Wells were then filled with 3 ml complete growth medium. After 8 days of infection, cells were trypsinized, centrifuged at 300 rcf for 3 min and resuspended in 4 ml growth medium. Then, 1 ml was added to Vero E6 cells that had been seeded at 2 × 10⁵cells per ml 18–20 h earlier in a T25 flask (approximately 1:8 donor-to-target cell dilution ratio) for cell-to-cell infection. The coculture of ACE2-expressing H1299-E3 and Vero E6 cells was incubated for 1 h and the flask was then filled with 7 ml of complete growth medium and incubated for 6 days. The viral supernatant was aliquoted and stored at −80°C or further passaged in Vero E6 cells as described above. Two isolates were expanded, 501Y. V2.HV001 and 501Y.V2.HVdF002. The second isolate showed fixation of mutations in the furin cleavage site during expansion in Vero E6 cells and was not used except for data presented inExtended Data Fig. 1.
Microneutralization using the focus-forming assay
For plasma from donors infected with first-wave virus variants, we first quantified IgG targeting the spike RBD by enzyme-linked immunosorbent assay (ELISA) using the monoclonal antibody CR3022 (used at fourfold serial dilutions from 1,000 ng ml−1to 0.244 ng ml−1) as a quantitative standard (n= 13 excluding participant 039-13-0103, for whom ELISA data were not available). The mean concentration was 23.7 ± 19.1 μg ml−1(range, 5.7–62.6 μg ml−1). In comparison, control samples from donors who were not infected with SARS-CoV-2 had a mean of 1.85 ± 0.645 μg ml−1. To quantify neutralization, Vero E6 cells were plated in an 96-well plate (Eppendorf or Corning) at 30,000 cells per well 1 day before infection. Notably, before infection approximately 5 ml sterile water was added between wells to prevent wells at the edge drying more rapidly, which we have observed to cause edge effects (lower number of foci). Plasma was separated from EDTA-anticoagulated blood by centrifugation at 500 rcf for 10 min and stored at −80°C. Aliquots of plasma samples were heat-inactivated at 56°C for 30 min and clarified by centrifugation at 10,000 rcf for 5 min, after which the clear middle layer was used for experiments. Inactivated plasma was stored in single-use aliquots to prevent freeze–thaw cycles. For experiments, plasma was serially diluted twofold from 1:100 to 1:1,600; this is the concentration that was used during the virus–plasma incubation step before addition to cells and during the adsorption step. As a positive control, the GenScript A02051 anti-spike monoclonal antibody was added at concentrations listed in the figures. Virus stocks were used at approximately 50 focus-forming units per microwell and added to diluted plasma; antibody–virus mixtures were incubated for 1 h at 37°C, 5% CO2. Cells were infected with 100 μl of the virus–antibody mixtures for 1 h, to allow adsorption of virus. Subsequently, 100 μl of a 1× RPMI 1640 (Sigma-Aldrich, R6504), 1.5% carboxymethylcellulose (Sigma-Aldrich, C4888) overlay was added to the wells without removing the inoculum. Cells were fixed at 28 h after infection using 4% paraformaldehyde (Sigma-Aldrich) for 20 min. For staining of foci, a rabbit anti-spike monoclonal antibody (BS-R2B12, GenScript A02058) was used at 0.5 μg ml−1as the primary detection antibody. Antibody was resuspended in a permiabilization buffer containing 0.1% saponin (Sigma-Aldrich), 0.1% BSA (Sigma-Aldrich) and 0.05% Tween-20 (Sigma-Aldrich) in PBS. Plates were incubated with primary antibody overnight at 4°C, then washed with wash buffer containing 0.05% Tween-20 in PBS. Secondary goat anti-rabbit horseradish peroxidase (Abcam ab205718) antibody was added at 1 μg ml−1and incubated for 2 h at room temperature with shaking. The TrueBlue peroxidase substrate (SeraCare 5510–0030) was then added at 50 μl per well and incubated for 20 min at room temperature. Plates were then dried for 2 h and imaged using a Metamorph-controlled Nikon TiE motorized microscope with a 2× objective. Automated image analysis was performed using a custom script in MATLAB v.2019b (Mathworks), in which focus detection was automated and did not involve user curation. Image segmentation steps were stretching the image from minimum to maximum intensity, local Laplacian filtering, image complementation, thresholding and binarization. Two plasma donors initially measured from the second infection wave in South Africa did not have detectable neutralization of either 501Y.V2 or the first-wave variant and were not included in the study.
Statistics and fitting
All statistics and fitting were performed using MATLAB v.2019b. Neutralization data were fit to
where Tx is the number of foci normalized to the number of foci in the absence of plasma on the same plate at dilutionD. To visualize the data, we used percentage neutralization, calculated as (1 − Tx) × 100%. Negative values (Tx > 1, enhancement) were presented as 0% neutralization. Data were fitted to a normal distribution using the function normplot in MATLAB v.2019b, which compared the distribution of the Tx data to the normal distribution (seehttps://www.mathworks.com/help/stats/normplot.html).
Extended Data
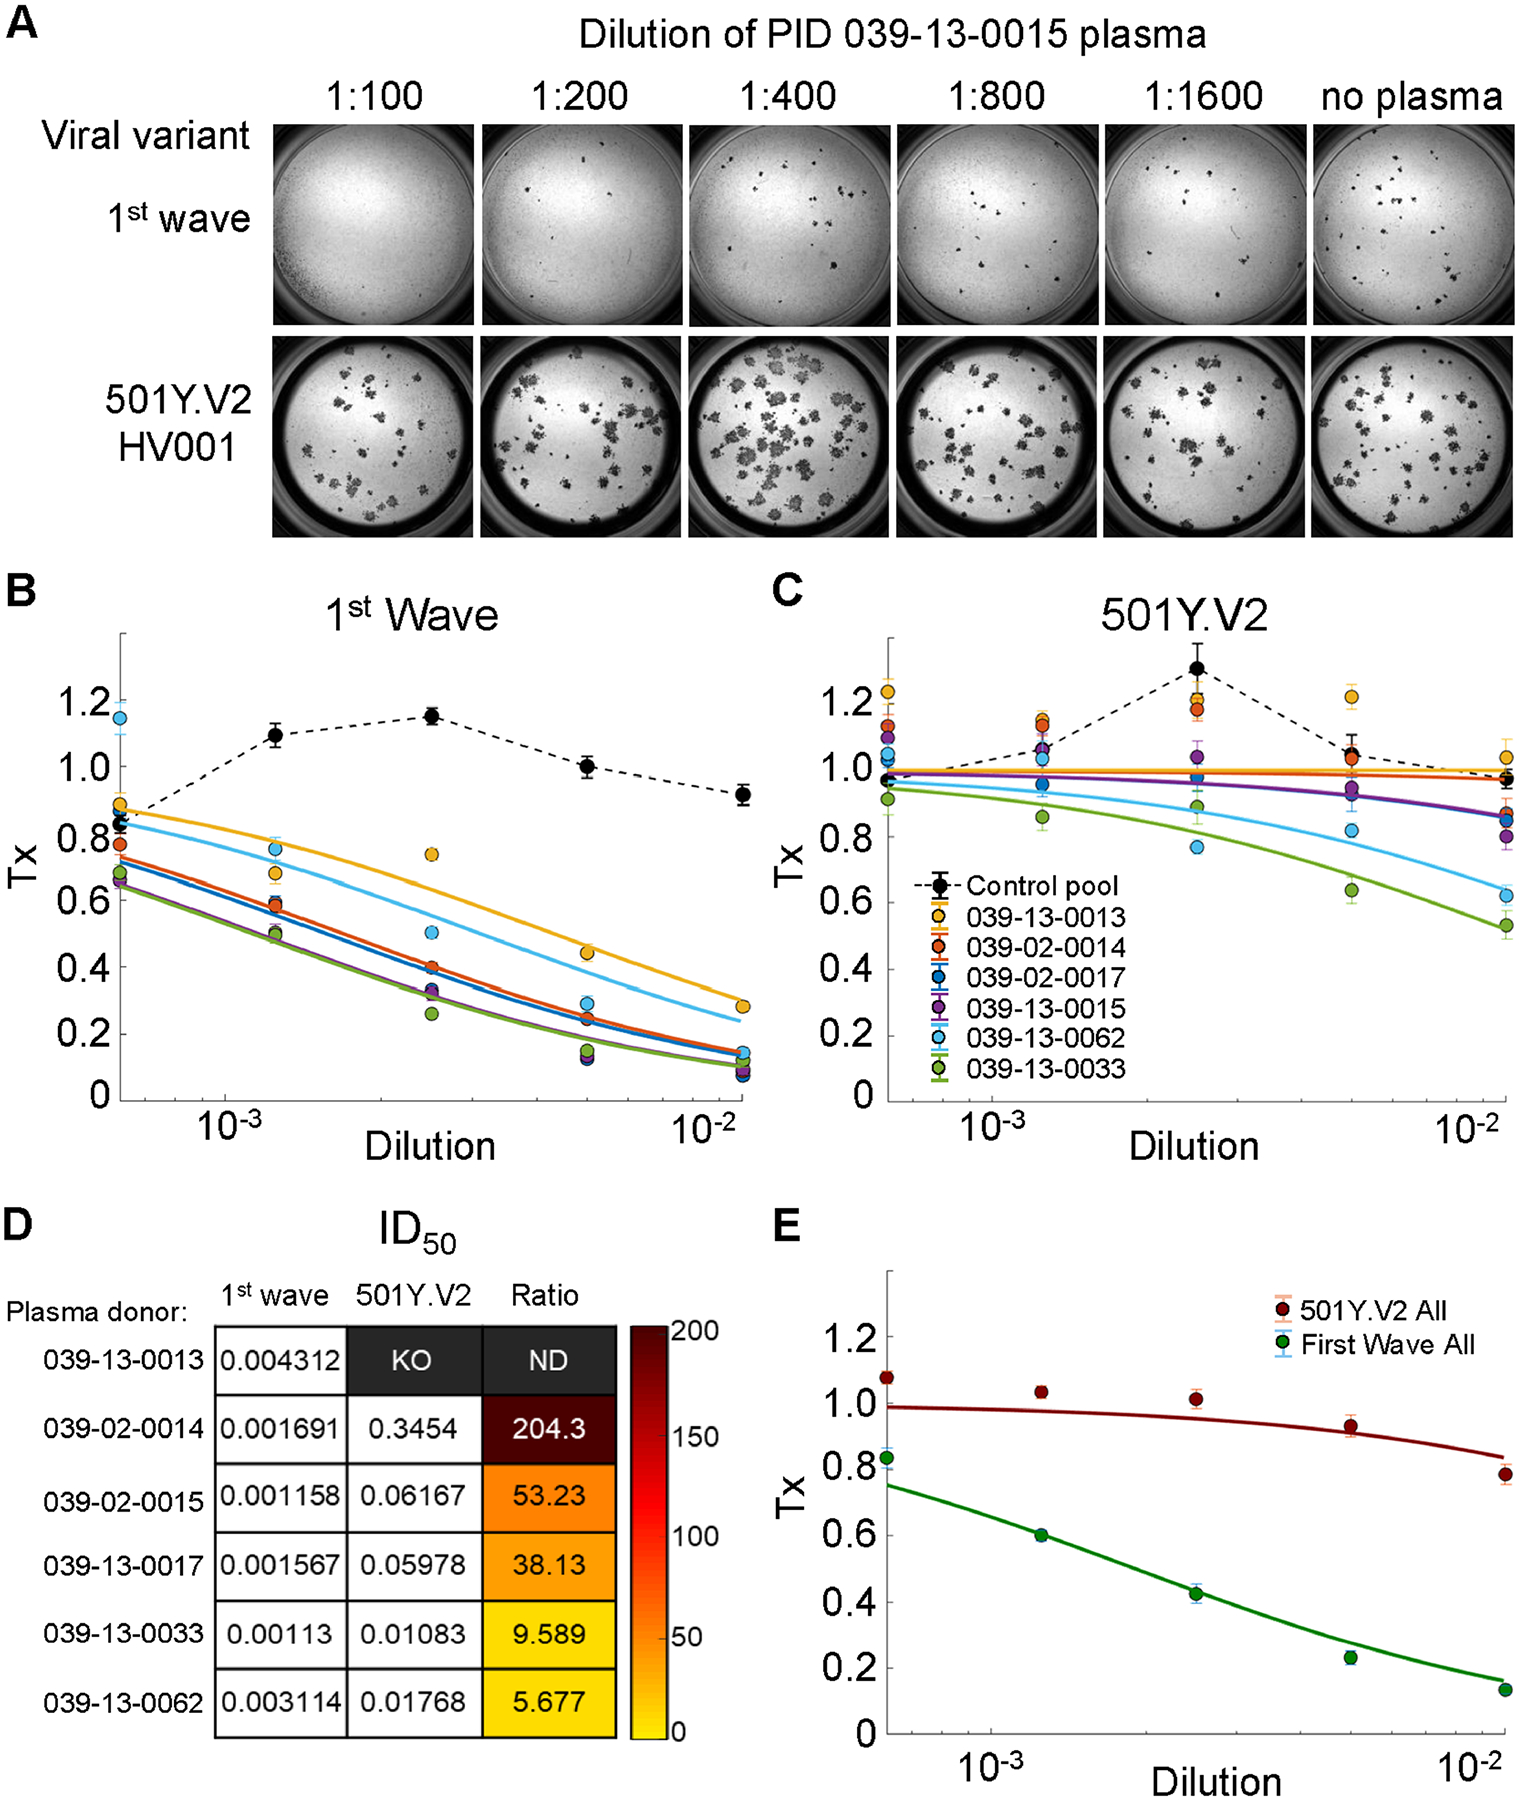
Extended Data Fig. 1 |. Neutralization of first-wave and 501Y.V2 variants by convalescent plasma from first-wave infections using equal infection incubation times.
a, A representative focus-forming assay using plasma from participant 039-13-0015.b,c, Plasma neutralization of first-wave virus (b) and 501Y.V2 variants (501Y.V2.HV001 and 501Y.V2.HVdF002) (c). Coloured circles represent mean ± s.e.m. from 8 independent neutralization experiments using plasma fromn= 6 participants convalescing from an infection with first-wave variants in the first peak of the pandemic in South Africa. Correspondingly coloured lines are fits of the sigmoidal equation with ID50as the fitted parameter. Data from both 501Y.V2 variants were combined to obtain a more accurate fit as neutralization of 501Y.V2 virus infection was low in the range of plasma concentrations used. The matched infections with first-wave virus that were done in parallel with each 501Y.V2 variant were also combined. One experiment was removed in the process of quality control owing to plate edge effects, which were subsequently corrected by adding sterile water between wells. Black points represent a pool of plasma from three uninfected control individuals. The transmission index (Tx) is the number of foci in the presence of the plasma dilution normalized to the number of foci in the absence of plasma.d, Plasma ID50values and ratios for first-wave and 501Y.V2 variants. Knockout (KO) was scored as ID50> 1. ND, not defined.e, Plasma neutralization of all first-wave and all 501Y.V2 variants combined. Data are mean ± s.e.m. across all plasma donors (n= 6) from 8 independent neutralization experiments.
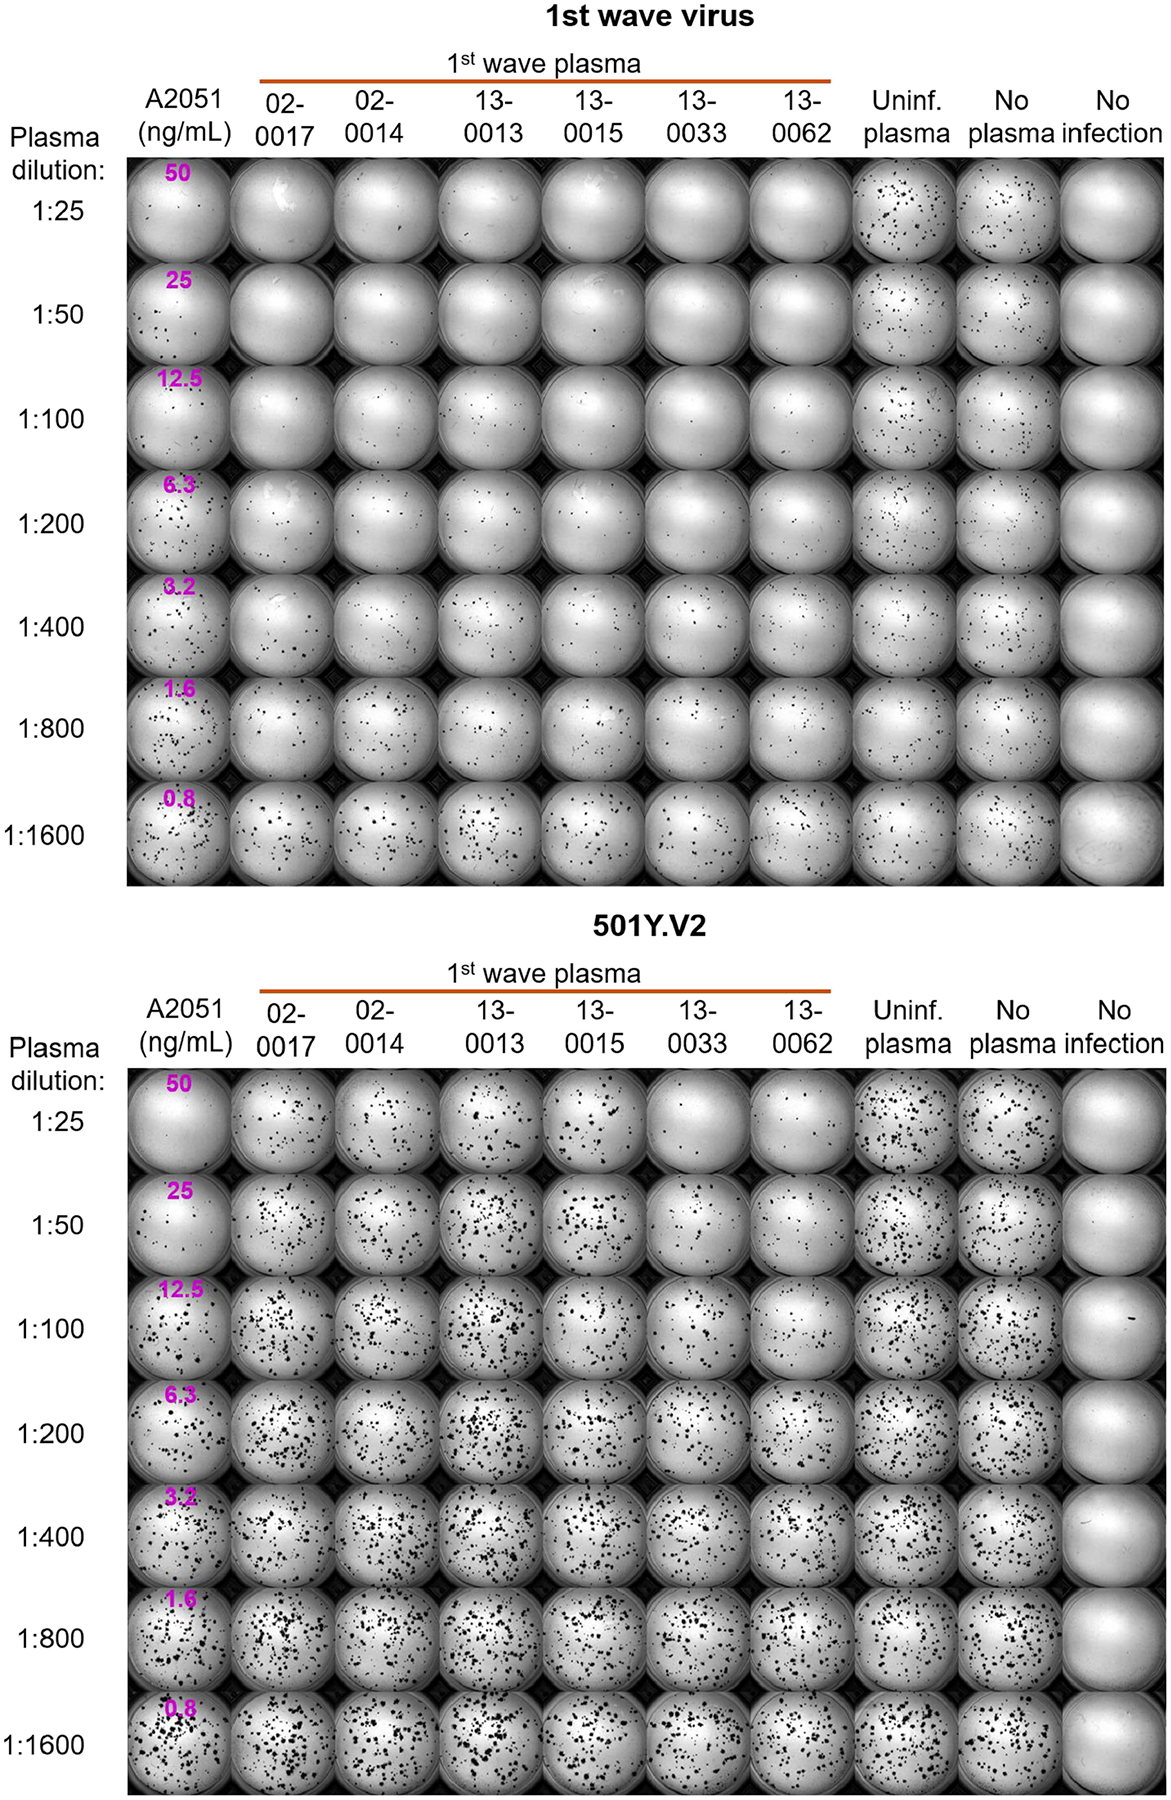
Extended Data Fig. 2 |. Neutralization of first-wave and 501Y.V2 variants by convalescent plasma: representative experiments of the first set of participant plasma tested.
Top, neutralization of first-wave virus. Bottom, neutralization of 501Y.V2. Rows are plasma dilutions, ranging from 1:25 to 1:1,600. The last three columns comprise plasma from a pool of uninfected participants, the no-plasma control and no-virus control, respectively. The first column is the neutralizing antibody A2051, with antibody concentrations in ng ml−1(magenta). First-wave plasma donors are marked with a red line.
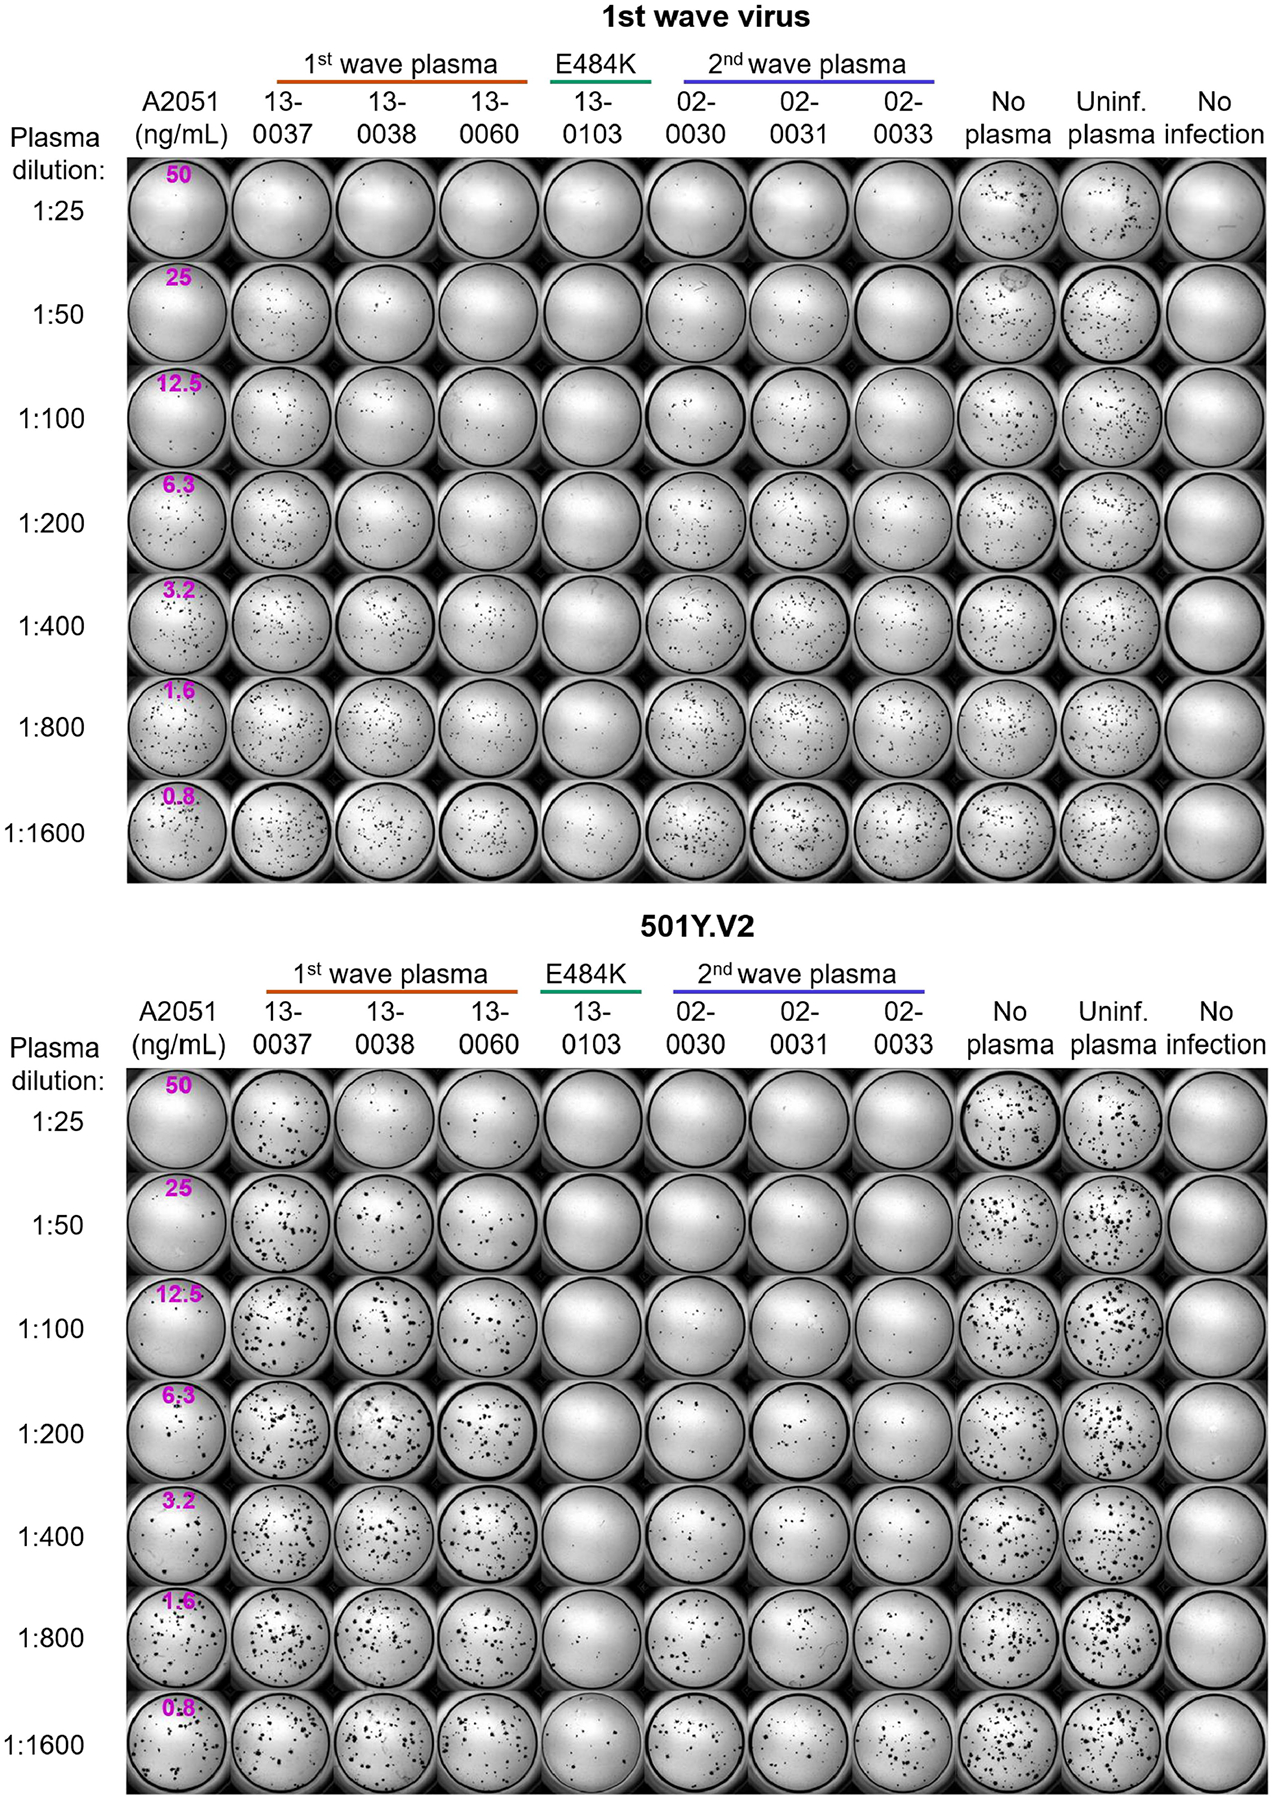
Extended Data Fig. 3 |. Neutralization of first-wave and 501Y.V2 variants by convalescent plasma: representative experiments of the second set of participant plasma tested.
Top, neutralization of first-wave virus. Bottom, neutralization of 501Y.V2. Rows are plasma dilutions, ranging from 1:25 to 1:1,600. The last three columns comprise plasma from a pool of uninfected participants, the no-plasma control and no-virus control, respectively. The first column is the neutralizing antibody A2051, with antibody concentrations in ng ml−1(magenta). First-wave plasma donors are marked with a red line; second-wave plasma donors are marked with a blue line; and the plasma donor who was infected with SARS-CoV-2 with the E484K substitution only is marked with a green line.
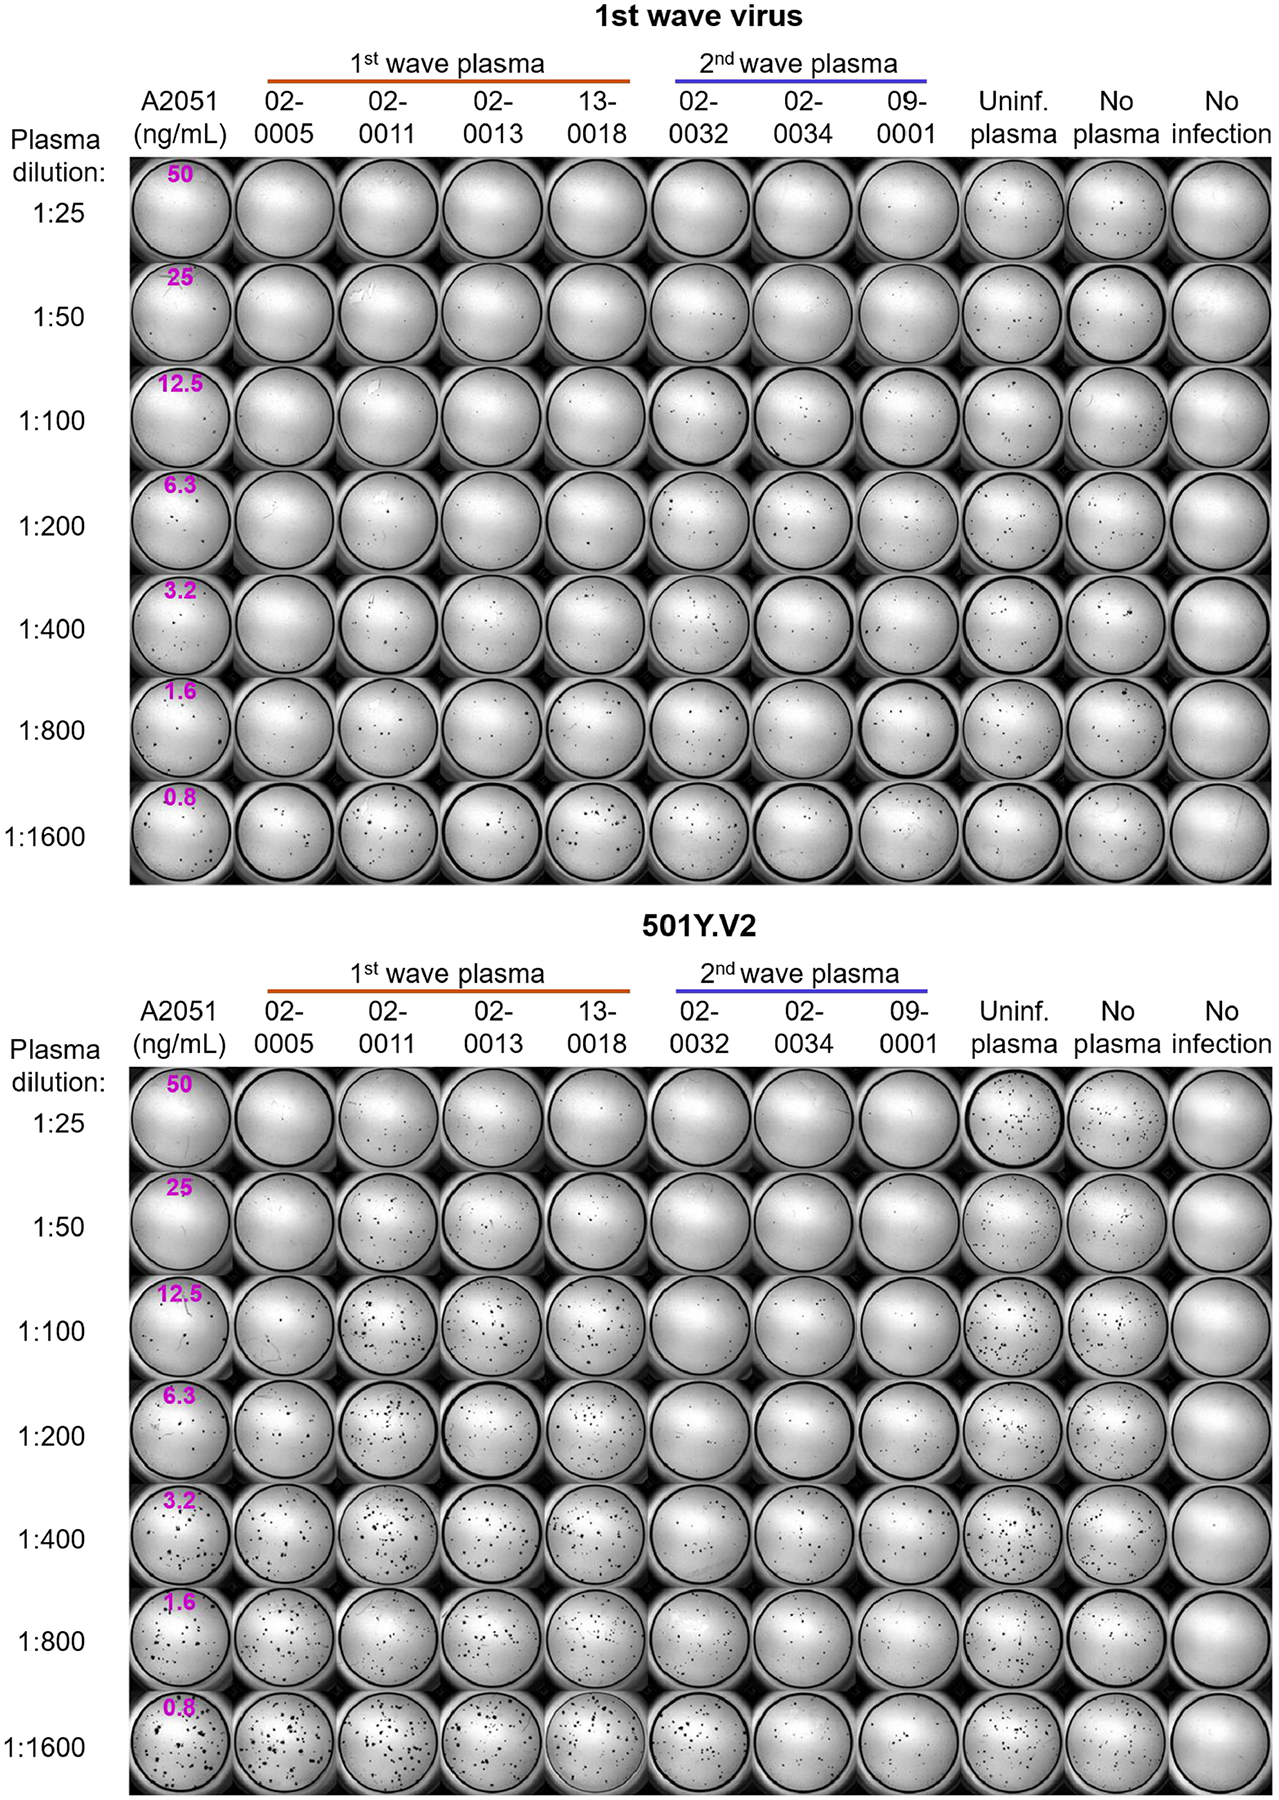
Extended Data Fig. 4 |. Neutralization of first-wave and 501Y.V2 variants by convalescent plasma: representative experiments of the third set of participant plasma tested.
Top, neutralization of first-wave virus. Bottom, neutralization of 501Y.V2. Rows are plasma dilutions, ranging from 1:25 to 1:1,600. The last three columns comprise plasma from a pool of uninfected participants, the no-plasma control and no-virus control, respectively. The first column is the neutralizing antibody A2051, with antibody concentrations in ng ml−1(magenta). First-wave plasma donors are marked with a red line and second-wave plasma donors are marked with a blue line.
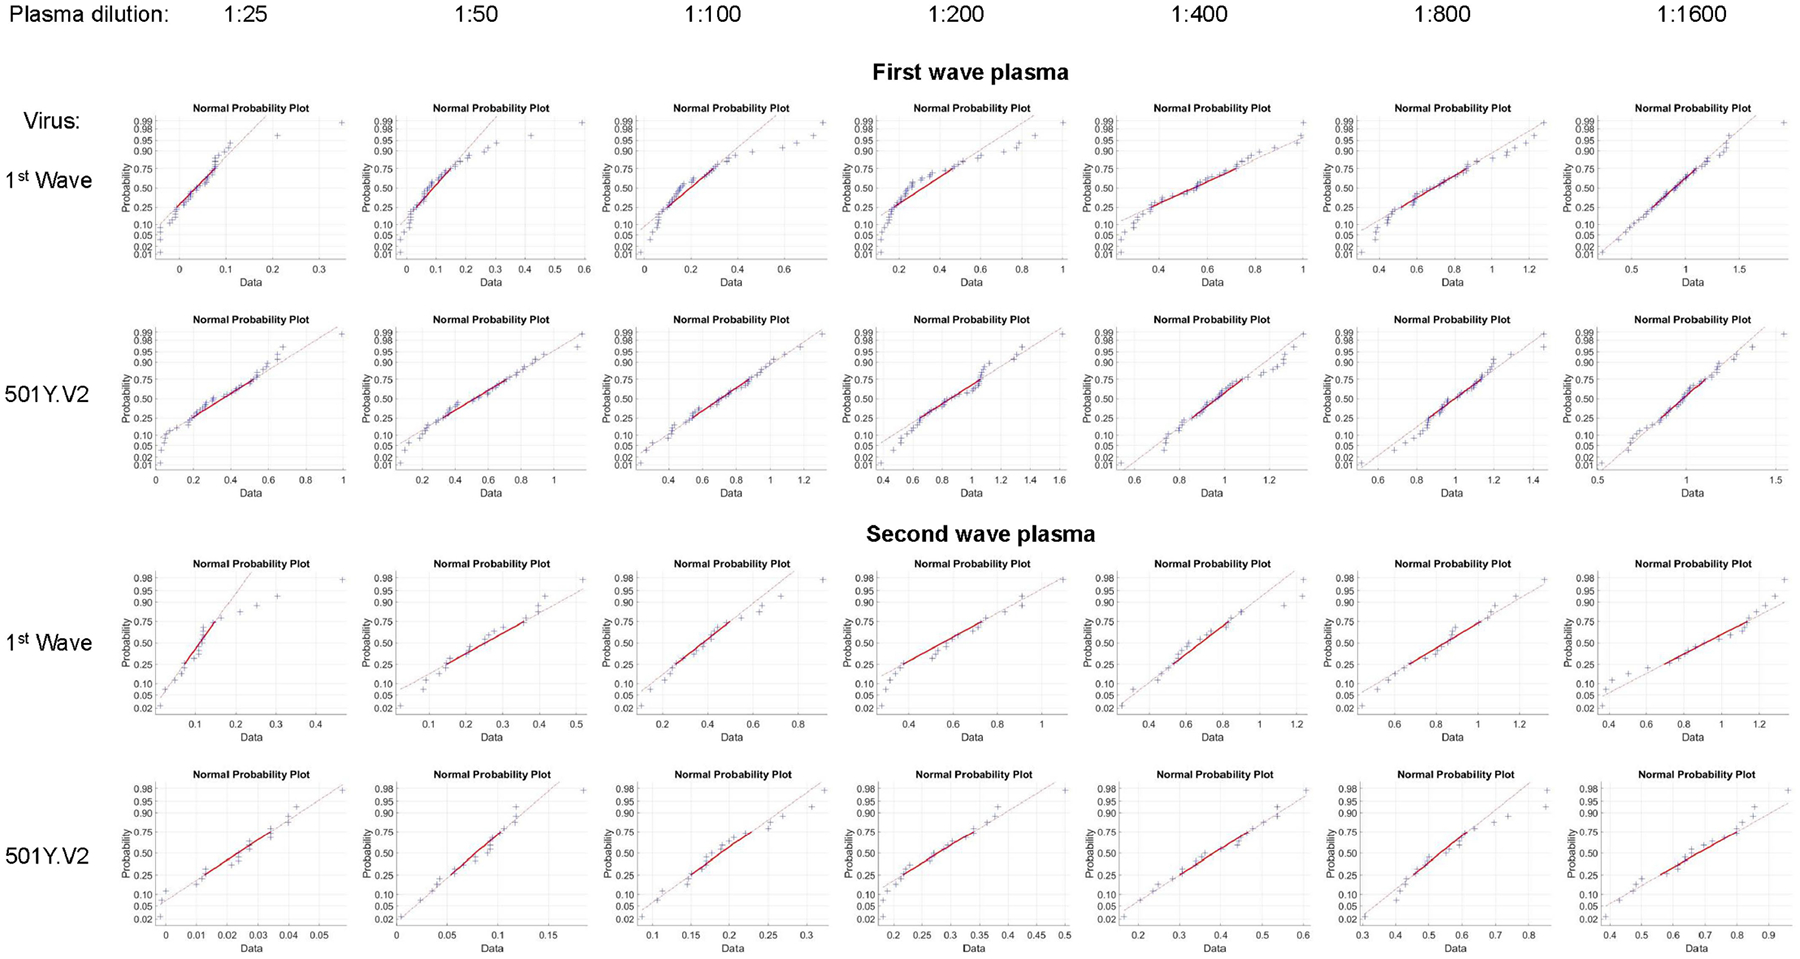
Extended Data Fig. 5 |. Fit of combined data for each plasma dilution to a normal distribution.
The function normplot in MATLAB v.2019b was used to assess the fit of the data (blue crosses) to a normal distribution (solid red line). For each plot, one data point is the Tx result for one experiment for one participant at the specified dilution. The number of total experiments per viral variant wasn= 42 for first-wave plasma andn= 21 for second-wave plasma. Lack of pronounced curvature of the data in the range of the solid line indicates that the data are a reasonably good fit to a normal distribution. Seehttps://www.mathworks.com/help/stats/normplot.htmlfor additional information.
This work was supported by the Bill and Melinda Gates Investment INV-018944 (A.S.) and by the South African Medical Research Council and the Department of Science and Innovation (T.d.O.).
Footnotes
Reporting summary
Further information on research design is available in the Nature Research Reporting Summary linked to this paper.
Sequence data that support the findings of this study have been deposited in GISAID with accession codes listed inSupplementary Table 1. Raw images are available from the corresponding authors upon reasonable request.
References
1.Tegally Het al. Detection of a SARS-CoV-2 variant of concern in South Africa. Nature10.1038/s41586-021-03402-9 (2021).[DOI] [PubMed] [Google Scholar]
2.Faria NRet al. Genomics and epidemiology of a novel SARS-CoV-2 lineage in Manaus, Brazil. Preprint at 10.1101/2021.02.26.21252554 (2021).[DOI] [PMC free article] [PubMed]
3.Madhi SAet al. Efficacy of the ChAdOx1 nCoV-19 COVID-19 vaccine against the B.1.351 variant. N. Engl. J. Med10.1056/NEJMoa2102214 (2021).[DOI] [PMC free article] [PubMed] [Google Scholar]
4.Piccoli Let al. Mapping neutralizing and immunodominant sites on the SARS-CoV-2 spike receptor-binding domain by structure-guided high-resolution serology. Cell183, 1024–1042 (2020).[DOI] [PMC free article] [PubMed] [Google Scholar]
5.McCallum Met al. N-terminal domain antigenic mapping reveals a site of vulnerability for SARS-CoV-2. Cell10.1016/j.cell.2021.03.028 (2021).[DOI] [PMC free article] [PubMed] [Google Scholar]
18.Wibmer CKet al. SARS-CoV-2 501Y.V2 escapes neutralization by South African COVID-19 donor plasma. Nat. Med10.1038/s41591-021-01285-x (2021).[DOI] [PubMed] [Google Scholar]
19.Hoffmann Met al. SARS-CoV-2 variants B.1.351 and B.1.1.248: escape from therapeutic antibodies and antibodies induced by infection and vaccination. Preprint at 10.1101/2021.02.11.430787 (2021).[DOI]
20.Planas Det al. Sensitivity of infectious SARS-CoV-2 B.1.1.7 and B.1.351 variants to neutralizing antibodies. Nat. Med10.1038/s41591-021-01318-5 (2021).[DOI] [PubMed] [Google Scholar]
21.Skelly DTet al. Vaccine-induced immunity provides more robust heterotypic immunity than natural infection to emerging SARS-CoV-2 variants of concern. Preprint at 10.21203/rs.3.rs-226857/v1 (2021).[DOI]
22.Wang Pet al. Antibody resistance of SARS-CoV-2 variants B.1.351 and B.1.1.7. Nature10.1038/s41586-021-03398-2 (2021).[DOI] [PubMed] [Google Scholar]
23.Karim Fet al. HIV infection alters SARSCoV-2 responsive immune parameters but not clinical outcomes in COVID-19 disease. Preprint at 10.1101/2020.11.23.20236828 (2020).[DOI]
25.Case JB, Bailey AL, Kim AS, Chen RE & Diamond MSGrowth, detection, quantification, and inactivation of SARS-CoV-2. Virology548, 39–48 (2020).[DOI] [PMC free article] [PubMed] [Google Scholar]
26.Sigal Aet al. Cell-to-cell spread of HIV permits ongoing replication despite antiretroviral therapy. Nature477, 95–98 (2011).[DOI] [PubMed] [Google Scholar]
27.Shen Let al. Dose-response curve slope sets class-specific limits on inhibitory potential of anti-HIV drugs. Nat. Med14, 762–766 (2008).[DOI] [PMC free article] [PubMed] [Google Scholar]
28.Tarke Aet al. Comprehensive analysis of T cell immunodominance and immunoprevalence of SARS-CoV-2 epitopes in COVID-19 cases. Cell. Rep. Med2, 100204 (2021).[DOI] [PMC free article] [PubMed] [Google Scholar]
Associated Data
This section collects any data citations, data availability statements, or supplementary materials included in this article.
Sequence data that support the findings of this study have been deposited in GISAID with accession codes listed inSupplementary Table 1. Raw images are available from the corresponding authors upon reasonable request.